37 INSANE Linux Commands you NEED to Know in 2025
Based on NetworkChuck's video on YouTube. If you like this content, support the original creators by watching, liking and subscribing to their content.
Use ncdu for interactive, visual disk-usage triage, and duff for a cleaner drive-usage view when you want quick readability.
Briefing
A fast, practical lineup of Linux commands is framed around one goal: make day-to-day troubleshooting, navigation, monitoring, and automation feel less painful—often by swapping familiar tools for faster, more visual, or more interactive alternatives. The centerpiece is a “power-user” toolkit that turns common admin tasks (disk space, processes, networking, logs, hardware inspection) into commands with better defaults, richer output, and tighter feedback loops.
Disk pressure and storage forensics kick things off with ncdu, a visual, interactive disk-usage browser that replaces the more manual DF/DU workflow. duff is positioned as a prettier, more readable take on drive usage, while ripgrep (rg) is pitched as a Rust-powered search tool that quickly finds errors in logs, locates Python functions, and even hunts for sensitive strings like API keys. For remote work, Mosh is presented as the roaming-friendly alternative to SSH—keeping sessions alive as networks change—though it requires Mosh installed on both ends.
Hardware and performance visibility then gets a series of “single-purpose but high-signal” commands. lshw can dump detailed hardware resources, with quick filtering for CPU and memory. glances acts as an all-in-one dashboard, and io top focuses on disk I/O pressure in real time. stat provides file-level detail down to timestamps and filesystem-specific metadata, while dstat and watch help track system behavior continuously—dstat as a combined timeline view (CPU, RAM, disk, network) and watch as a simple rerunner for commands like nvidia-smi to monitor GPU utilization.
Networking troubleshooting gets multiple layers: MTR for hop-by-hop latency and packet loss, dig replaced by dog for cleaner DNS lookups (including DNS over TLS and JSON output), and termshark as a terminal UI for packet inspection with interactive filtering (like focusing on DNS). lsof helps map open ports to owning processes, and IP calc handles subnet math quickly—turning CIDR inputs into ranges, masks, and wildcard information.
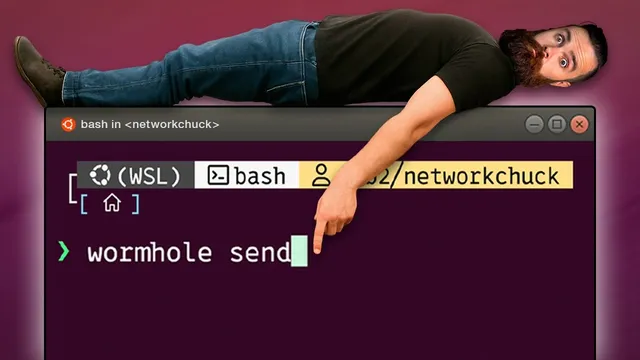
Operational hygiene and workflow upgrades round out the list. ranger brings a Vim-flavored terminal file manager with previews and bulk renaming; Zoxide replaces cd with frequency- and recency-ranked directory jumping; Exa replaces ls with better color and optional icon support. For containers, lazydocker offers an interactive Docker terminal UI, while rsync is recommended for efficient, resumable transfers over SSH. System startup debugging leans on systemd-analyze (including blame and critical-chain) to pinpoint slow boot dependencies.
The transcript also highlights “quality-of-life” utilities—progress for monitoring secure copy, shred for safer deletion, jq for JSON querying and transformation, taskwarrior for CLI task management, and Ask Cinema/Asciinema for recording and replaying terminal sessions (plus GIF conversion for quick sharing). Finally, AI is woven into command creation: Ollama is used to run a local model that can generate commands on demand (like finding disk space hogs), including custom agent behavior to craft shell commands interactively. The overall message is that Linux power comes from choosing the right tool for the job—often one step more interactive, visual, or automation-friendly than what people default to.
Cornell Notes
The transcript strings together 37 Linux commands that target the most common pain points in administration and daily terminal work: storage, searching, remote access, hardware/performance monitoring, networking diagnostics, and workflow speed. Instead of relying on older defaults, it repeatedly swaps in tools with better output (ncdu, duff, exa), faster search (ripgrep), and more interactive interfaces (ranger, lazydocker, fzf). For troubleshooting, it pairs visibility commands like lshw, glances, io top, stat, dstat, and watch with networking tools like MTR, dog, termshark, and lsof. It also adds practical sharing and automation utilities—Asciinema recordings, jq for JSON, rsync for transfers, and AI-assisted command generation via Ollama.
How do ncdu, duff, and ripgrep change the way storage and sensitive data searches are handled?
Why is Mosh treated as a better remote-access option than SSH in unstable networks?
Which commands provide real-time system monitoring, and what does each focus on?
How do the networking tools in the list work together for diagnosis?
What workflow upgrades replace common terminal habits like cd, ls, and ps?
How do rsync, shred, jq, and Asciinema support safer transfers, safer deletion, data handling, and sharing?
Review Questions
- Which command would you use to visually drill into what’s consuming disk space, and how does it differ from DF/DU workflows?
- If a remote shell drops when switching networks, which tool is recommended and what installation requirement does it have?
- How would you combine MTR, termshark, and lsof to move from “something is slow” to “which hop and which process is involved”?
Key Points
- 1
Use ncdu for interactive, visual disk-usage triage, and duff for a cleaner drive-usage view when you want quick readability.
- 2
Swap in ripgrep (rg) for fast, targeted text searching across logs and code, including hunting for secrets like API keys.
- 3
Choose Mosh for remote sessions that must survive network changes, but install it on both the client and server.
- 4
Monitor systems in real time with purpose-built tools: glances for broad visibility, io top for disk I/O pressure, and watch for periodic command reruns like nvidia-smi.
- 5
Diagnose networking issues with a toolkit approach: MTR for hop-by-hop latency/loss, dog for DNS lookups (including DNS over TLS and JSON), termshark for interactive packet inspection, and lsof to map ports to processes.
- 6
Speed up terminal navigation and listing by replacing cd/ls with Zoxide and Exa, and replace ps with procs for a more usable process view.
- 7
Improve operations and sharing with rsync (efficient/resumable transfers), shred (safer deletion), jq (JSON querying), and Asciinema (record/replay terminal sessions).