Are University Admissions Biased? | Simpson's Paradox Part 2
Based on minutephysics's video on YouTube. If you like this content, support the original creators by watching, liking and subscribing to their content.
Overall admissions comparisons can be misleading when groups apply to different departments with different acceptance rates.
Briefing
University admissions can look biased in aggregate even when each department’s decisions are fair. In a cat-and-human thought experiment, the overall acceptance rate favors neither group: cats and humans each face different outcomes at the university level (3 accepted out of 7 total for cats, 3 accepted out of 8 total for humans), yet the pattern flips when admissions are examined department by department. Astronomy accepts 50% of cats and 50% of humans, while physics accepts 33% of cats and 33% of humans. The apparent unfairness at the university level arises because the applicant pool is unevenly distributed across departments: more cats apply to the astronomy department (which admits a higher fraction), while more humans apply to physics (which admits a lower fraction). Simpson’s paradox—where trends reverse when data are aggregated—explains how discrimination can be masked or manufactured by mixing groups with different application patterns.
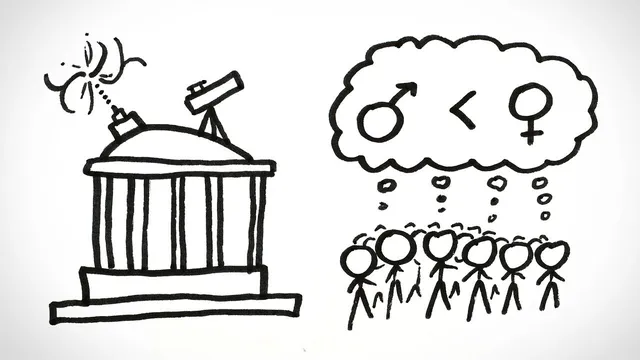
A real-world parallel emerged at the University of California, Berkeley, in the 1970s. Admissions data showed men accepted at a higher overall rate (44%) than women (35%) to the graduate school. Careful analysis traced the gap not to within-department admissions rules but to where applicants applied. Women tended to apply to departments with less funding and fewer available places—fields such as English—while men more often applied to less competitive departments, including engineering. Within each department, the evidence of gender discrimination in admissions was weak or absent; if anything, women were favored. Still, the unequal distribution of women and men across departments produced an unequal distribution of outcomes overall.
That raises a harder question: what drives the unequal distribution in the first place? One possibility is strategic manipulation—an institution could advertise different departments differently to different groups, exploiting how aggregated statistics can mislead. More realistically, reputations and incentives matter. Some fields may be perceived as unwelcoming or unsupportive toward women even when admissions are formally equitable. Universities and departments also attract applicants who may already be influenced by gendered career stereotypes, steering students toward different programs before any application review occurs.
The Berkeley findings culminated in a broader conclusion that the admissions system’s apparent lack of demonstrable bias does not prove the absence of bias elsewhere in education. A 1975 statistics paper captured the core mechanism: women were “shunted towards fields of study that are generally more crowded, less productive of completed degrees, less well funded, and that frequently offer poorer professional employment prospects.” The paradox, then, isn’t a flaw in statistics; it’s a warning about how slowly institutions and societies respond when bias shows up indirectly—through application patterns, funding disparities, and the reputations that shape who applies where. Even today, the underlying lesson remains: unequal outcomes can persist even when the admissions process itself looks fair at the level where decisions are made, because the upstream forces that shape applicant choices may still be unequal.
Cornell Notes
Simpson’s paradox can make admissions look discriminatory at the university level even when each department’s acceptance rates are similar for different groups. In the cat-and-human example, astronomy admits cats and humans at the same 50% rate, and physics admits both at the same 33% rate; the overall gap appears only because cats and humans apply to different departments in different proportions. Berkeley’s 1970s graduate admissions data followed the same pattern: men had a higher overall acceptance rate (44% vs. 35%), but within departments there was little evidence of gender bias. The real issue was where applicants applied—women more often to less funded, more crowded departments, men more often to less competitive ones. The key implication is that bias may operate earlier in the educational pipeline, shaping choices before admissions decisions occur.
How can overall acceptance rates suggest discrimination when department-level rates look fair?
What did Berkeley’s analysis find about the source of the men–women admissions gap?
Why does unequal application distribution matter even if admissions rules are equitable within departments?
What upstream factors could create the unequal distribution of applicants across departments?
What does the 1975 statistics conclusion imply about bias beyond admissions?
Review Questions
- In the cat-and-human example, which department-level acceptance rates are equal across groups, and how does the applicant mix create a different university-level outcome?
- What evidence from Berkeley’s case suggests the admissions gap was driven more by application patterns than by within-department discrimination?
- What kinds of mechanisms could shift applicants toward different departments before admissions decisions are made?
Key Points
- 1
Overall admissions comparisons can be misleading when groups apply to different departments with different acceptance rates.
- 2
Department-level fairness can coexist with university-level inequity if applicant pools are unevenly distributed across departments.
- 3
Berkeley’s 1970s admissions gap (44% men vs. 35% women) was largely explained by where applicants applied, not by within-department admissions bias.
- 4
Unequal application distribution can stem from reputational effects, funding and capacity differences, and gendered career stereotypes that shape choices upstream.
- 5
Bias may persist even when admissions decisions appear equitable at the level where decisions are made.
- 6
The core lesson is that statistics can reveal where disparities originate, but the real work is addressing the upstream causes that generate unequal applicant mixes.