Attributes and values in NVIVO
Based on Qualitative Researcher Dr Kriukow's video on YouTube. If you like this content, support the original creators by watching, liking and subscribing to their content.
NVivo doesn’t automatically assign participant attributes, so attributes and values must be added manually to cases.
Briefing
NVivo doesn’t automatically attach participant attributes (like age or gender) to cases, so building a useful classification sheet requires adding attributes and then filling in their values manually. The payoff is a table that lists each participant alongside structured characteristics—making it possible to compare coding patterns later, such as contrasting participants with “poor childhood” against those without it.
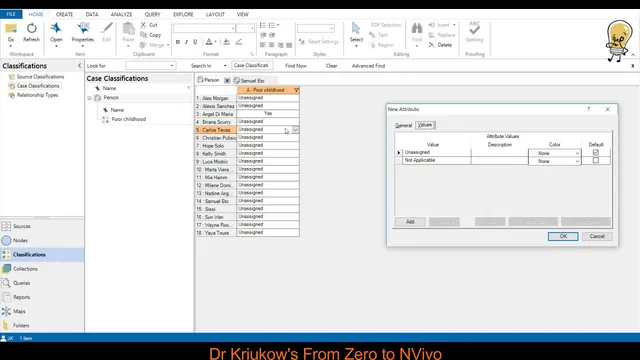
The process starts by right-clicking a person classification and choosing “add a new attribute.” For each attribute, the user must set (1) an attribute name and (2) a value format that determines how values will appear in the classification sheet. NVivo offers several formats: numerical values (entered as numbers), text values (entered as words), date/time (or both), and binary yes/no responses. Using the yes/no option, the transcript walks through creating an attribute called “Poor childhood.” After defining the attribute, the classification sheet gains a new column. Participants can then be marked “yes” or “no” by selecting the appropriate value for each person, turning narrative biographies into a structured dataset that can be inspected and compared.
Next comes adding age. Age uses the numerical format, and the transcript highlights a practical difference: while some attributes can be enumerated with a fixed set of options, age is too granular to list every possible number in advance. Instead, the user leaves the values to be entered manually per participant. An example participant is shown with a birth year of 1988, which the transcript converts into an age of 37; the value “37” is then typed into the classification sheet for that participant.
Gender is added as a text attribute because its values are categorical labels rather than measurements. The user defines the allowed options—“male” and “female”—then selects the appropriate label for each participant in the table. With these steps, the classification sheet evolves from a list of case names into a participant profile table that supports both visual inspection and later analysis.
The transcript also frames this as an early-stage research tool, not just a technical setup. Even when detailed queries aren’t planned yet, attributes and values help researchers spot differences across characteristics. It encourages experimentation because attribute formats can constrain what’s possible—for example, an “age range” attribute can’t be represented with a numerical format that expects single values; it requires text options like “20–30” or “30–40.” The overall message is straightforward: define attributes carefully, choose formats that match the kind of data you need, and iterate until the classification sheet fits the analysis goals.
Cornell Notes
NVivo requires manual setup of participant attributes because it doesn’t automatically assign characteristics like age or gender to cases. The workflow is to right-click a person classification, add a new attribute, name it, and choose a value format (numerical, text, date/time, or yes/no). After defining the attribute, values are entered directly in the classification sheet—using yes/no selections for something like “Poor childhood,” typing numbers for age, and selecting predefined text options for gender. This structure turns biographies into a participant profile table that supports comparison and later coding analysis, while also encouraging experimentation when attribute formats don’t fit (e.g., “age range” needs text categories).
Why does a classification sheet initially show only case names in NVivo?
What determines how values appear for a given attribute in NVivo?
How does the transcript use a yes/no attribute to support later comparison?
Why is age handled differently from attributes like gender?
How is gender represented, and what does that imply about attribute format choice?
What’s the key lesson about attribute formats when modeling “age range”?
Review Questions
- When adding an attribute in NVivo, what two decisions must be made before any values can be entered?
- Give one example of an attribute that fits a yes/no format and explain why that format works.
- Why would “age range” require a different setup than “age” in NVivo?
Key Points
- 1
NVivo doesn’t automatically assign participant attributes, so attributes and values must be added manually to cases.
- 2
Creating a classification sheet with meaningful columns requires adding attributes via right-clicking the person classification and selecting “add a new attribute.”
- 3
Each attribute needs a name and a value format (numerical, text, date/time, or yes/no) that determines how values can be entered.
- 4
Use yes/no formats for binary characteristics like “Poor childhood,” enabling straightforward participant grouping for later comparison.
- 5
Enter age as numerical values per participant rather than pre-listing every possible number.
- 6
Represent categorical labels like gender using a text attribute with predefined options (e.g., “male,” “female”).
- 7
Choose formats that match the data structure; “age range” typically needs text categories rather than a numerical single-value setup.