Avi Flax - Set your data free with model-based architecture diagramming
Based on Write the Docs's video on YouTube. If you like this content, support the original creators by watching, liking and subscribing to their content.
Treat architecture diagrams as outputs of an underlying architecture model rather than as the primary place where architectural meaning lives.
Briefing
Software architecture diagrams work best when the underlying architecture is treated as a model—separate from the visuals—so teams can collaborate on the “what” without getting stuck in the “how.” The core claim is that most diagramming practice fuses two activities that don’t have to be fused: discovering/confirming architectural elements (modeling) and drawing a learning-oriented representation (illustrating). When those are entangled, diagrams become hard to maintain, difficult to review, and resistant to version control; when they’re separated, architecture knowledge becomes reusable data.
The talk frames the problem with a familiar organizational reality: growing systems, acquisitions, and distributed teams often leave organizations unable to answer basic questions like “what systems do we have?”—and then, once they do, “why are so many systems connected to everything else?” Architecture diagrams are positioned as a practical way to answer those questions because they help people learn and reason about relationships. But the usual workflow—sketching boxes and lines in a tool like a whiteboard or diagram editor while simultaneously inventing the model—creates a documentation bottleneck. The result is often diagrams that are visually convincing yet structurally fragile: they’re hard to diff, hard to keep consistent, and easy to duplicate.
To fix that, the talk proposes a separation of content and presentation, explicitly mapping “content” to the model and “presentation” to the visualization. “Modeling” is defined in the OED sense as devising a simplified description of a system to assist analysis and prediction. “Illustrating,” by contrast, is the learning-focused act of devising a visual representation of elements and relationships. The separation is presented as beneficial in several concrete ways. First, it broadens collaboration: architecture model work can be handled by people who understand the system, while visualization work can be handled by people skilled at making diagrams readable. Second, it improves consistency over time: a single model can generate multiple diagrams, so changes propagate automatically rather than requiring manual edits across many files. Third, it enables “docs as code” workflows: if the model is text, teams can use version control, pull requests, and review tools to manage architectural changes like software. Fourth, it turns architecture into data: once the model is reified as data, it can be imported, exported, queried, and used as a living catalog of systems.
The talk then lays out tools that support this approach, emphasizing ones with strong documentation and text-based or data-oriented workflows. C4 is highlighted as a meta-model for creating software architecture models and diagram types; Simon Brown’s C4 model and the Structurizr toolkit are recommended for generating diagrams from a C4-based model. PlantUML-based options (including C4 PlantUML and C4 Builder) are suggested for teams already using PlantUML. Croki is presented as a web API for rendering diagrams from textual formats. For the “model as data” idea, the talk points to Datasets as a way to publish and query model data through a web UI and API.
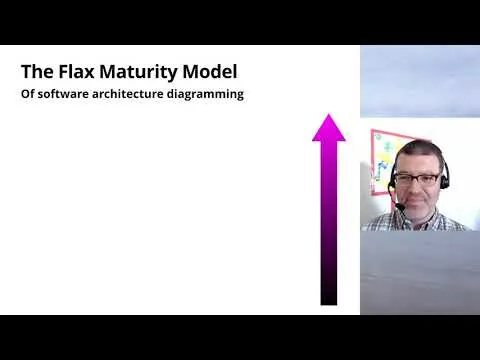
A maturity model for diagramming practice is introduced as a progression: level 0 blends model and visualization in manual illustration; level 1 separates a discrete model but still relies on manual visuals; level 2 makes the model text to unlock code-style collaboration; level 3 makes the model data for repurposing; and level 4 treats both model and visuals as data so diagrams can be generated automatically. The closing message is less about chasing a perfect tool and more about adopting the mindset shift: keep the architectural meaning in the model, and let visuals be derived—because learning and maintainability depend on that separation.
Cornell Notes
The talk argues that software architecture diagrams become far more useful when teams separate the architecture “model” (content) from the diagram “visualization” (presentation). Modeling is treated as a simplified description that supports analysis, while illustrating is the learning-oriented act of rendering relationships visually. That separation enables collaboration across roles, keeps diagrams consistent by generating multiple views from one model, and supports “docs as code” via text-based models and version control. When models are reified as data, they can be imported, exported, queried, and used as a living catalog of systems. A maturity model outlines a path from manual, intertwined diagramming toward model-and-visuals-as-data workflows.
Why does conflating diagram drawing with architecture modeling create maintenance problems?
What does “separating content and presentation” mean in practice for architecture diagrams?
How does the separation improve collaboration inside an organization?
What concrete benefits come from making the model text and/or data?
What is the C4 model’s role in this approach?
How does the flax maturity model describe progress in diagramming practice?
Review Questions
- In what ways does a text-based architecture model change how teams review and maintain diagrams compared with editing diagrams directly?
- Which benefits in the talk depend specifically on the model being treated as data rather than just text?
- Where does the talk place the “learning” value of diagrams—inside the model, inside the visualization, or in the relationship between them?
Key Points
- 1
Treat architecture diagrams as outputs of an underlying architecture model rather than as the primary place where architectural meaning lives.
- 2
Separate modeling (discovering/confirming elements and relationships) from illustrating (rendering relationships for learning).
- 3
Use a single model to generate multiple synchronized visualizations, reducing duplication and inconsistency.
- 4
Store the model as text to enable “docs as code” workflows like version control, diffs, and pull-request style review.
- 5
Reify the model as data to support importing, exporting, querying, and using architecture knowledge as a catalog.
- 6
Adopt a maturity progression: manual intertwined diagrams → discrete model → text model → data model → model-and-visuals-as-data generation.