Building a Custom Dashboard in Obsidian For Easy Organization
Based on Prakash Joshi Pax's video on YouTube. If you like this content, support the original creators by watching, liking and subscribing to their content.
Create a new “dashboard” note and apply a CSS class so the dashboard++ styling activates.
Briefing
A custom Obsidian dashboard can be built from scratch by combining a banner plugin, a community CSS snippet that enables multi-column layouts, and DataView/JavaScript widgets for live file and progress tracking. The payoff is a single “home” note that organizes projects, reading lists, recent activity, navigation links, and at-a-glance stats—without waiting for Obsidian’s native layout features to catch up.
The build starts with a new note named “dashboard” in a fresh vault. A banner is added using the Banner plugin, which supports either an image stored in the vault or a linked image from the web. The transcript uses an image generated via MidJourney (an AI image tool) and then pasted as a URL into the note’s front matter. Next comes styling: a custom CSS snippet called “dashboard++” (credited to TFT agar) is copied into Obsidian’s Snippets folder via Settings → Appearance → Snippets. After enabling the snippet and applying a CSS class (the note gets a “dashboard” class), the note begins behaving like a dashboard rather than a plain markdown page.
Obsidian itself doesn’t support true multi-column layouts, so the CSS snippet does the heavy lifting. The dashboard layout is driven by bullet lists: each top-level bullet becomes its own column. Line breaks separate sections, and indented sub-bullets stay inside the same column and can be folded/unfolded. To make the columns fit different screens, the CSS includes a “minimum width” setting (the transcript shows 390px producing three columns on a 1920×1080 display, 500px shrinking the layout to two columns, and 300px expanding it to four). Users can tune this value to match their monitor size so the dashboard remains readable.
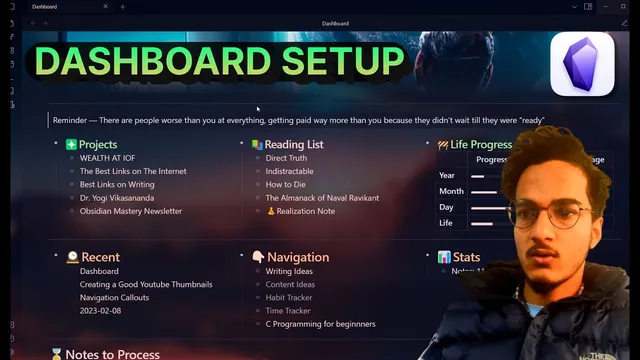
Once the column system is in place, the dashboard content is assembled. The transcript’s example includes a Projects section with relevant links, a Reading List with books currently being read and books to read next, and a Live progress bar created with DataView and JavaScript. A Recent Files section is generated via a DataView query that lists recent items along with navigation stats, and a Navigation column provides quick links. A Stats area is implemented using DataView with card-style CSS. The dashboard also uses a theme named anuprofen and adds the banner from the same setup.
Two practical polish tips follow: add headings to bullet items (the transcript uses level-3 headings under bullets) and use emojis to make sections scannable. For emoji insertion, the Emoji toolbar plugin is recommended, along with its hotkey workflow. Finally, the dashboard can be set as a home page using the Home Page plugin (shown with 74,000+ downloads). The home page can replace open notes, replace only the last note, or open alongside existing notes, and it can be configured to refresh DataView queries on each open. The result is a dashboard that functions as both an organization hub and a launch screen every time Obsidian starts.
Cornell Notes
The dashboard setup turns a single Obsidian note into a multi-column home base by pairing Banner for a top image, a community CSS snippet (“dashboard++”) for column layout, and DataView/JavaScript for dynamic widgets. Multi-column behavior is achieved through bullet-list structure: each top-level bullet becomes a column, while indented bullets stay within that column and can be folded. The CSS includes a minimum-width setting that controls how many columns fit on a screen, so users can tune it for their monitor. The example dashboard includes projects links, a reading list, a live progress bar, recent files via DataView queries, navigation links, and stats cards. Setting the note as a Home Page makes it open automatically and optionally refresh DataView queries each time.
How does the CSS dashboard create multiple columns in Obsidian, given that Obsidian doesn’t natively support them?
What determines how many columns appear on screen, and how can it be adjusted?
What’s the role of the Banner plugin in the dashboard build?
How are dynamic elements like recent files and progress typically implemented?
What steps turn the dashboard into an automatic home page when Obsidian opens?
Review Questions
- When you change the dashboard CSS “minimum width,” what visible change should you expect in the number of columns, and why?
- How does the bullet-list indentation level affect which content stays inside a given dashboard column?
- Which plugins are used for (1) the banner image, (2) emoji insertion, and (3) automatically opening the dashboard as a home page?
Key Points
- 1
Create a new “dashboard” note and apply a CSS class so the dashboard++ styling activates.
- 2
Use the Banner plugin with front matter to place a top image, either from the vault or via a URL.
- 3
Enable the “dashboard++” snippet by copying dashboard CSS into Obsidian’s Snippets folder and reloading.
- 4
Build columns using bullet lists: each top-level bullet becomes a column, and indented bullets remain within that column.
- 5
Tune the dashboard CSS minimum-width setting to control how many columns fit on different screen sizes.
- 6
Generate recent files, navigation stats, and stats cards with DataView queries; use DataView plus JavaScript for a live progress bar.
- 7
Set the dashboard as Obsidian’s home page with the Home Page plugin and configure whether DataView refreshes on open.