Building a USEFUL Habit Tracker in Obsidian
Based on FromSergio's video on YouTube. If you like this content, support the original creators by watching, liking and subscribing to their content.
Install the Obsidian Tracker plugin and use daily note templates to store habit values as YAML front matter.
Briefing
A practical habit-tracking system in Obsidian can be built entirely from local notes by combining the Obsidian Tracker plugin with simple front-matter metadata in daily notes. The core idea is to treat each habit as a “yes/no” (or numeric) value stored in YAML, then let Tracker automatically render calendars, streaks, summaries, and charts—replacing the need for separate paid habit apps while keeping everything inside the vault.
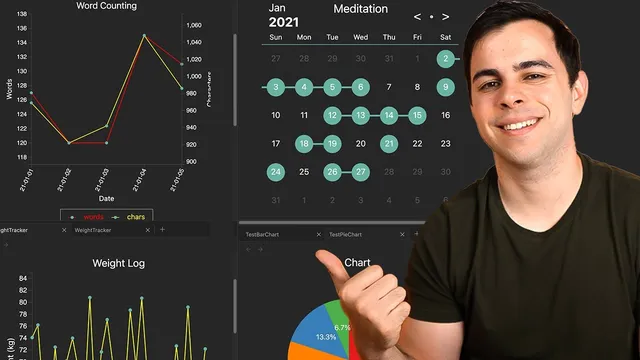
The setup starts with installing the Obsidian Tracker plugin via Community Plugins and choosing a date format. From there, habits are recorded through templates: the daily note template gets a YAML front-matter header for each habit. For a first example, meditation is tracked as 1 (done) or 0 (missed). After creating daily notes for specific dates, a dedicated “meditation tracker” page is created in a habits folder. The Tracker query is structured in three parts—search type, target, and output. Using search type “front matter,” the query targets the meditation header inside the daily notes folder (Journal daily). For output, a “month” view produces a calendar-style grid showing which days have 1s and which have 0s. Changing a day from 1 to 0 immediately breaks the streak, making the feedback loop visible.
To make the tracker more useful than a basic calendar, the page is customized with parameters like week start day (Monday), color (including hex codes), and even emoji annotations. The tracker can also be restricted to specific date ranges using start and end date settings. A second query adds a “summary” output using a template pulled from the plugin documentation; this summary computes streak-related stats such as min/max/median and—crucially for habit-building—average behavior over time. The workflow is designed to scale: the same yes/no method can track other binary habits like reading, avoiding fast food, or attending yoga classes.
The system then expands beyond binary habits. A weight tracker stores numeric values (e.g., 170 pounds / 77 kilograms) in daily note YAML, with changes recorded as gains or losses. Its Tracker query uses a line graph output to visualize trends over time, with axis labels and units (pounds) customizable and color tuning for readability. A work tracker follows the same pattern but tracks Pomodoro counts; daily YAML headers are updated (e.g., 13, 14, 15), and the tracker renders a line or bar chart plus summary statistics.
Tracker also supports fully automated metrics. A word tracker uses file metadata (num words) to chart writing volume without manually entering counts. It can even aggregate totals across the vault. Finally, mood tracking demonstrates numeric scales (1–5) and shows how multiple values can be plotted together in one output—combining Pomodoro counts and mood on the same chart with separate colors, left/right y-axis placement, and a legend. The result is a modular set of habit dashboards that can be embedded into an Obsidian dashboard layout, with charts that update as soon as daily notes are edited.
Cornell Notes
The Obsidian Tracker plugin turns YAML metadata in daily notes into usable habit dashboards. Habits are recorded in the daily note template as front-matter fields; binary habits use 1/0 values, while numeric habits store actual numbers (like weight, Pomodoros, or mood). Tracker queries specify (1) where to search (front matter or file metadata), (2) what target header or metric to use, and (3) how to render results (month calendar, line/bar charts, or summary stats). Customization options—date ranges, week start day, colors/hex codes, emoji annotations, axis labels, and fixed scale—make the outputs readable and consistent. The same approach scales from meditation streaks to weight trends, work productivity, word counts, and multi-metric charts.
How does the system record a “yes/no” habit like meditation so Tracker can render a streak calendar?
Why add a second “summary” query after the month view?
What changes when tracking weight instead of a binary habit?
How can a word tracker be “fully automated” without entering word counts manually?
How does the mood tracker use numeric scales, and what’s the benefit of plotting mood against Pomodoros together?
Review Questions
- What are the three main parts of a Tracker query (search type, target, output), and how do they differ between a month calendar and a line chart?
- For a binary habit, how do 1 and 0 values affect streak behavior in the month view?
- When switching from meditation to weight tracking, which YAML value type changes (binary vs numeric), and which output type changes (month vs chart)?
Key Points
- 1
Install the Obsidian Tracker plugin and use daily note templates to store habit values as YAML front matter.
- 2
Track binary habits by writing 1 (done) or 0 (missed) into a dedicated front-matter header for each daily note.
- 3
Create a separate tracker page per habit by using Tracker queries with search type front matter, a folder target (Journal daily), and month output for streak-style calendars.
- 4
Add a second summary query to get aggregate streak and performance statistics, not just day-by-day completion.
- 5
Use line or bar chart outputs for numeric habits like weight and Pomodoros, and customize axis labels, units, and colors for clarity.
- 6
Leverage file metadata (num words) to build automated trackers that update without manually entering counts.
- 7
Combine multiple targets (e.g., Pomodoros and mood) in a single chart using legends and left/right y-axis placement to compare relationships.