Convert your research paper into Presentation with this AI tool
Based on Qualitative Researcher Dr Kriukow's video on YouTube. If you like this content, support the original creators by watching, liking and subscribing to their content.
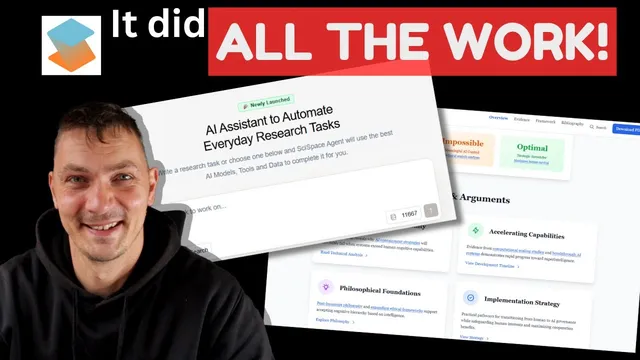
SciSpace is positioned as an AI agent that turns uploaded research text and data into slide decks, infographics, animations, and interactive websites.
Briefing
An AI agent called SciSpace is being pitched as a one-stop system for turning research and other information into polished visual outputs—PowerPoint-style slide decks, infographics, animations, and even fully functioning websites with interactive tabs and menus. The core promise is straightforward: feed it text, data, charts, or literature, and it generates presentation-ready materials without requiring users to micromanage the structure.
The most concrete demonstration comes from an article the reviewer co-authored on EMI—English Medium Instruction—and the global spread of English as a lingua franca. Instead of providing detailed instructions, the user uploaded the literature review and asked only for an infographic. The tool then produced a live URL for an infographic that functions like a lightweight website, built specifically from the literature review rather than from the study’s results. It also generated content aligned with the article’s academic framing: defining EMI, outlining driving forces behind EMI, and identifying research gaps—despite the user not specifying those elements.
The second, more striking example uses a draft manuscript on artificial intelligence, focused on artificial superintelligence and the future of humans and AI. This time, the user attached the entire manuscript and intentionally stayed vague, asking for a live website based on the full text rather than only the literature review or results. The resulting site is described as interactive and marketing-ready, including features such as a summary, framework overview, evidence and argument summaries, an AI development timeline, research highlights (including the user’s own quotes), and navigable sections like methodology, references, and downloadable paper/PDF options. The site also includes call-to-action elements positioned like typical marketing layouts.
A key practical detail is that the website remains available after the initial creation: once generated under a paid plan, the user can use it and then becomes a free user without losing access to the already-built site. The reviewer frames this as a major advantage for researchers and professionals who need to package work quickly—whether for academic presentations, workplace reporting, or marketing research to broader audiences.
While the tool is positioned as useful beyond academia—aimed at students, lecturers, and professionals—the transcript also notes that it can do more than visuals, including writing reports and manuscripts (though the reviewer discourages relying on it for full paper writing). Overall, the emphasis is on speed, automation, and the ability to convert messy or lengthy research text into structured, visually engaging deliverables in roughly 10–15 minutes, with outputs delivered as shareable links.
Cornell Notes
SciSpace is presented as an AI agent that converts uploaded research text into presentation-ready visuals and even live websites. In one example, an EMI literature review was turned into an infographic website via a simple request, generating definitions, driving forces, and research gaps without detailed prompting. In another example, a full AI manuscript draft was transformed into an interactive website with summaries, evidence and argument overviews, an AI development timeline, research highlights, and navigable sections like methodology and references. The workflow is framed as fast (about 10–15 minutes) and shareable through live URLs. A practical claim is that once the site is created under a paid plan, it remains available even after switching to a free user.
What kinds of outputs does SciSpace generate from research inputs?
How did the tool handle the EMI example when the user gave minimal instructions?
What changed in the second example when the user uploaded the entire manuscript instead of just the literature review?
Why does the transcript emphasize marketing-style features in the generated website?
What practical advantage is claimed about access after paying for the tool?
Review Questions
- In the EMI example, what specific parts of the article did the generated infographic draw from, and what did it produce without detailed prompting?
- Compare the outputs requested in the two demonstrations: what was uploaded and what was asked for each time?
- What features of the generated website are described as interactive and marketing-oriented, and how might those features affect how research is shared?
Key Points
- 1
SciSpace is positioned as an AI agent that turns uploaded research text and data into slide decks, infographics, animations, and interactive websites.
- 2
A literature-review-only input can generate an infographic delivered as a live URL, including definitions, driving forces, and research gaps without detailed instructions.
- 3
Uploading an entire manuscript can produce a full interactive website with summaries, evidence/argument overviews, timelines, research highlights, and navigable sections like methodology and references.
- 4
Generated sites include call-to-action elements such as download options, making them suitable for both academic presentation and research marketing.
- 5
The workflow is described as fast—about 10–15 minutes for a live website—making it practical for workplace or student deadlines.
- 6
The transcript claims that after creating a site under a paid plan, the site remains available even after switching to a free user.