Draw High Quality Scientific Images and Diagrams With AI Tools In FREE
Based on Dr Rizwana Mustafa's video on YouTube. If you like this content, support the original creators by watching, liking and subscribing to their content.
The transcript frames a common research gap: strong tools exist for writing and editing, but fewer options reliably produce custom scientific diagrams that match a document’s visual theme.
Briefing
Scientific figures and diagrams often determine whether a research document looks professional—and whether it stays compliant with publication expectations. A shortage of truly flexible, on-brand tools for creating custom scientific illustrations is driving researchers toward AI image generators, and this walkthrough argues that Canva’s free tier can produce high-quality, labeled scientific visuals when prompts are used carefully.
The discussion starts by placing the problem in context: researchers need support across the workflow (idea drafting, literature search, writing, editing, proofreading), yet options for drawing original scientific images that match a specific color theme or pattern are limited. Against that backdrop, the focus shifts to a practical comparison of prominent diagram tools, then narrows to one standout: Canva.
BioRender is presented as a strong option for scientific diagrams, especially for biology-specific icon libraries. After signing up, users can select subject-specific icons—such as epithelial cells—then click to insert labeled cell types. The tool’s depth is highlighted through its large vocabulary of cell categories, with cell names appearing when hovering. Access is tied to a 14-day free trial that requires card details. The pitch emphasizes that using templates and diagrams from such tools can help avoid AI-plagiarism concerns by producing visuals that are treated as genuine, citation-ready components rather than generic outputs.
Mind the Graph is introduced next as another paid tool with a gallery of infographic templates geared toward medical and natural sciences. Like BioRender, it relies on prompting to generate diagrams and illustrations, and the transcript notes that Canva can be used to access similar kinds of scientific imagery. The key differentiator in this segment is cost and scale: Canva is positioned as usable for free, while unlimited use requires a paid plan.
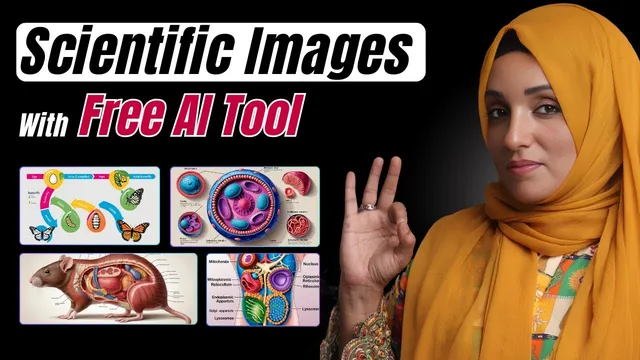
The core of the transcript then demonstrates Canva’s workflow. Users open Canva, select the AI image feature, and generate images from text prompts such as “draw the rat anatomy” or “draw human body cells with the labeling.” The outputs are described as copyright-free and plagiarism-free, and the images can be downloaded directly. Canva also supports image-guided generation: users can upload a sample image and choose whether the new result should match the sample’s style or design. After selecting an aspect ratio and pressing create, Canva generates multiple variations in one batch (four variations are mentioned), with 3D labeled diagrams.
Beyond cells and anatomy, the same prompting approach is applied to flowcharts and life cycles, including the life cycle of a butterfly and the life cycle of a frog, with multiple selectable samples. After generation, Canva’s editor can add text, logos, institute names, titles, and additional icons—turning AI outputs into publication-ready figures that maintain consistent branding.
Overall, the transcript’s takeaway is straightforward: Canva’s free features can deliver labeled, diagram-style scientific visuals comparable in look to paid tools, provided users prompt precisely and then refine the result in Canva’s editor for the specific document’s needs.
Cornell Notes
Canva is positioned as a practical way to generate labeled scientific diagrams and figures for research documents using free features—especially when prompts are specific and the results are edited afterward. The transcript compares Canva with paid diagram tools such as BioRender and Mind the Graph, noting BioRender’s large cell-type library and Mind the Graph’s infographic template gallery. Canva’s workflow includes generating images from text prompts (e.g., anatomy and labeled cells), and also generating variations from an uploaded sample image by matching either style or design. After creation, Canva’s editor lets users add labels, titles, logos, and other branding elements. The main value claim is that careful prompting plus editing can produce plagiarism- and copyright-safe visuals suitable for scientific use.
Why does the transcript argue that scientific diagram tools are hard to find for researchers’ specific needs?
What makes BioRender appealing for scientific illustration work, according to the transcript?
How does Mind the Graph fit into the comparison?
What are the two main ways Canva generates scientific images in the transcript?
What editing steps does Canva enable after generating a diagram?
Review Questions
- What specific Canva features (prompting, uploaded-image guidance, editor tools) are used to create labeled scientific diagrams, and how do they differ?
- Compare the transcript’s descriptions of BioRender and Mind the Graph: what libraries or template strengths are highlighted for each?
- What does “match style” versus “match design” mean in Canva’s workflow, and why might a researcher choose one over the other?
Key Points
- 1
The transcript frames a common research gap: strong tools exist for writing and editing, but fewer options reliably produce custom scientific diagrams that match a document’s visual theme.
- 2
BioRender is highlighted for its large biology icon vocabulary, including detailed cell-type categories, and it uses a 14-day free trial tied to card details.
- 3
Mind the Graph is presented as a paid alternative with infographic template libraries for medical and natural science processes.
- 4
Canva’s free tier can generate labeled scientific visuals using text prompts such as anatomy and labeled cell diagrams.
- 5
Canva can also generate diagram variations from an uploaded sample image, with choices to match either style or design.
- 6
Generated images can be refined in Canva’s editor by adding labels, titles, logos, and institute information to fit a specific research document.
- 7
The transcript emphasizes careful prompting and post-generation editing as the key to producing usable, publication-style figures without relying solely on paid tools.