EPIC! ChatGPT vision does INSANE things for research!
Based on Andy Stapleton's video on YouTube. If you like this content, support the original creators by watching, liking and subscribing to their content.
Upload schematics, graphs, and photo figures to extract process steps and key trends, then convert those into paragraph-ready text for manuscripts.
Briefing
ChatGPT’s image understanding is becoming a practical shortcut for science writing: upload figures, ask it to interpret what’s happening, then iterate until the key trends and details match the paper—turning hours of figure comprehension and draft text into a fast first pass. The most striking results come from feeding it peer-reviewed-style schematics, complex multi-axis graphs, and photo panels, often without providing captions. In those tests, it reliably identified the overall process steps (including the order of operations), extracted meaningful relationships from cluttered plots, and summarized what the figure is communicating—then converted that understanding into paragraph-ready text suitable for a thesis or manuscript.
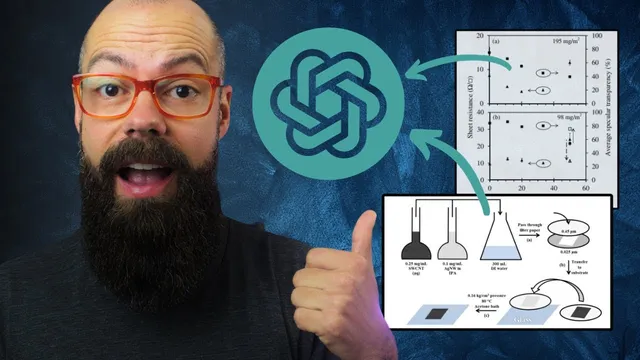
A clear example involves a schematic describing a transparent electrode made from carbon nanotubes and silver nanowires. Without the figure caption, ChatGPT still recognized the process structure: combining two solutions, passing them through filter paper, and describing what remains on the filter paper (including thickness/pattern formation). It made at least one mistake—stacking filter papers rather than the intended setup—but the error was described as fixable with a short follow-up correction. The same pattern showed up with a highly complex graph featuring many arrows, shared axes, and multiple data elements. Even without the caption, it produced an explanation that matched the major trends, such as the relationship between weight fraction of single-wall carbon nanotubes and properties like sheet resistance and average spectral transparency. While minor inaccuracies appeared, the “important trends” were treated as correct, which is exactly what researchers need when drafting figure narratives.
Photographic figures also worked well, especially when captions were included. For a structural stability experiment using acetone exposure across different film compositions, ChatGPT generated a paragraph that captured degradation behavior across columns—rapid degradation for the pure silver nanowire film and more limited structural changes for films with 20% single-wall carbon nanotube weight fraction. The transcript emphasizes that writing or supplying accurate figure captions boosts performance, likely because captions encode the experimental intent and column labels that the model might otherwise infer imperfectly.
Tables were the weak spot. A low-resolution table with mixed text and numbers was summarized correctly at a high level, but it struggled with specific numeric comparisons—such as which RS or RP values increased versus decreased. The workaround proposed is iterative prompting: correct the model by pointing out what’s wrong, then ask for a revised paragraph. Because the workflow is conversational rather than one-shot, the model can be guided toward the correct interpretation.
Finally, the transcript draws a comparison between paid and free tiers. ChatGPT Plus handled the same schematic prompts far better than a free/open model (“lava”), which missed key details in the schematic—details that matter most for research accuracy. The practical takeaway is a workflow: (1) screenshot someone else’s confusing figure and ask for an explanation, (2) upload your own figures and request trend extraction, (3) ask for paragraph-ready text, then (4) correct any mistakes and re-run the request. Used this way, image-capable ChatGPT becomes a self-editing tool for figure clarity and a time-saver for the “boring parts” of drafting scientific writing.
Cornell Notes
Image-capable ChatGPT can speed up scientific writing by interpreting figures and turning them into manuscript-ready text. In tests with peer-reviewed-style schematics, complex graphs, and photo panels, it often captured the right process steps and the correct overall trends—even when captions were omitted. Accuracy improves when figure captions and column labels are provided, especially for photographic experiments. Tables are harder when resolution is low, but iterative back-and-forth prompting can correct numeric mistakes. Paid ChatGPT Plus outperformed a free/open model on schematic detail extraction, suggesting tier differences matter for research-grade fidelity.
How does ChatGPT’s figure understanding translate into faster paper writing?
What happens when the model is given a schematic without its caption?
Can it handle complex graphs with many arrows and shared axes?
Why do captions matter for photographic figures?
What are the limitations with tables, and how are they addressed?
How did ChatGPT Plus compare to a free/open model on the same schematic task?
Review Questions
- When would you omit a figure caption, and what kinds of errors might you expect if you do?
- What iterative prompting steps would you use to correct a mistaken numeric comparison in a table?
- Which figure types (schematics, graphs, photos, tables) seem most reliable for trend extraction, and why might that differ?
Key Points
- 1
Upload schematics, graphs, and photo figures to extract process steps and key trends, then convert those into paragraph-ready text for manuscripts.
- 2
Expect minor mistakes even when major trends are correct; treat the workflow as iterative rather than one-shot.
- 3
Including accurate figure captions and column labels improves performance, particularly for photographic multi-panel experiments.
- 4
Complex graphs with shared axes and many annotations can still be summarized effectively, with the most important relationships often captured correctly.
- 5
Tables are more error-prone when resolution is low; correct numeric discrepancies through follow-up prompts and request a revised paragraph.
- 6
Paid ChatGPT Plus outperformed a free/open model on schematic detail extraction, suggesting tier choice affects research-grade fidelity.
- 7
Use figure interpretation as a self-editing tool: if the model can’t parse a figure, readers may struggle too.