Evidence and Gap Maps
Based on Evidence Synthesis Ireland's video on YouTube. If you like this content, support the original creators by watching, liking and subscribing to their content.
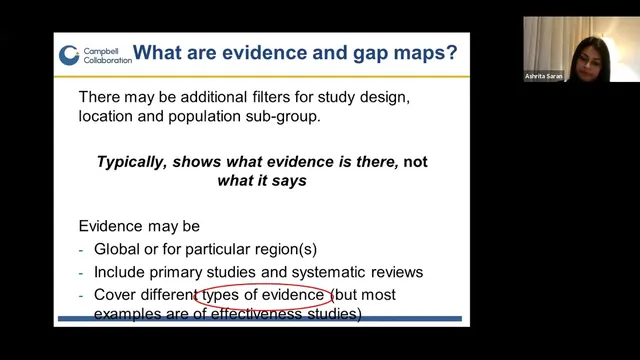
Evidence and gap maps organize research in an intervention-by-outcome matrix and use interactive filters to narrow evidence by design, population, and region.
Briefing
Evidence and gap maps are interactive, matrix-style evidence inventories that make it possible to see—at a glance—what interventions have been studied against which outcomes, where the evidence is strong, and where research is missing. Their value lies in helping funders and researchers avoid blind spots: instead of only asking what works, these maps show how much is known, what quality that knowledge has, and which gaps should drive future systematic reviews or new impact evaluations.
At the core is a structured “framework” that defines the map’s scope. Interventions typically form the rows and outcomes the columns, producing a grid of cells that can be populated with evidence items. Many versions also add filters—such as study design, population subgroup, region/country, and sometimes funding agency—so users can narrow the view to exactly the evidence they need. Campbell-style maps go further by attaching quality ratings and interactive features: bubble colors indicate evidence type and quality, bubble size reflects the volume of studies in each intervention–outcome cell, and clicking a bubble can open user-friendly summaries plus links back to the original sources.
The presentation contrasted evidence and gap maps with systematic reviews. Systematic reviews are narrower and aim to synthesize results to determine effectiveness; evidence and gap maps are broader and aim to catalog and organize what evidence exists. Both rely on rigorous, protocol-driven searching and screening, often with dual screening and conflict resolution. The key difference is what gets extracted and how: maps extract less outcome-level detail than systematic reviews because they are not designed to produce an effectiveness synthesis. That makes them quicker while still systematic.
A major theme was how evidence mapping evolved. Early work in the early 2000s used structured “evidence mapping” methods, with later breakthroughs bringing visualization and interactivity. By 2010, the International Initiative for Impact Evaluation (3ie) introduced evidence gap maps with interactive online versions. Over time, many organizations adapted the approach, leading to more than a dozen (and now many more) map-producing groups across sectors.
The talk also highlighted concrete examples of how Campbell has innovated beyond effectiveness. “Map of maps” aggregates completed evidence gap maps across international development topics, identifying priority areas for commissioning new maps. Mega-maps focus on broad domains like child welfare using systematic reviews only, then flagging where evidence is thin. In homelessness, Campbell developed an effectiveness map that critically appraised included studies—using tools such as an AMSTAR-based checklist for systematic reviews and a modified risk-of-bias tool for primary studies—then used the results to commission process-evaluation maps aimed at understanding barriers and facilitators. A country-focused Uganda map (2002–2018) illustrates the scale possible: hundreds of process, impact, and formative evaluations were captured, enabling country-level synthesis discussions.
Ultimately, evidence and gap maps function as building blocks in an “evidence architecture,” supporting knowledge brokering, evidence portals, and guideline development. They help identify where high-quality evidence exists, where absolute gaps mean no studies are available, and where “empty reviews” suggest systematic reviews may be premature. They also support research and funding priorities by reducing duplication—showing what others have already studied or are actively studying—so new work targets the most consequential missing evidence.
Cornell Notes
Evidence and gap maps are interactive, matrix-based inventories of research that show which interventions have been studied for which outcomes, along with evidence type, quality, and volume. They use a pre-specified framework to set scope (often interventions as rows and outcomes as columns) and then apply systematic searching and screening similar to systematic reviews, but with less data extraction because the goal is mapping rather than effectiveness synthesis. Filters (e.g., study design, population, region, sometimes funder) let users quickly locate relevant evidence and identify “absolute gaps” where no studies exist. Campbell-style maps also provide bubble-level user summaries and links to original sources, making evidence more discoverable and usable. The maps matter because they guide research and funding priorities, reduce duplication, and support evidence architecture through commissioning and evidence portal development.
What does an evidence and gap map look like, and what do the cells and visual cues represent?
How do evidence and gap maps differ from systematic reviews in purpose and workflow?
Why is building the framework (scope) the most critical step in creating a map?
What kinds of gaps can maps reveal, and how can those gaps be used?
How did Campbell-style mapping expand beyond effectiveness research?
What practical features make evidence and gap maps usable for researchers and funders?
Review Questions
- What elements of a map’s framework determine its scope, and why does that scope affect both searching and coding?
- In what ways can an evidence and gap map help prevent duplication of research efforts, and what does it look like when evidence is missing?
- How does the extraction and coding approach in evidence and gap maps enable broader coverage compared with systematic reviews?
Key Points
- 1
Evidence and gap maps organize research in an intervention-by-outcome matrix and use interactive filters to narrow evidence by design, population, and region.
- 2
A pre-specified framework is the foundation of a map: it determines what gets included, how searches are run, and how results are coded and interpreted.
- 3
Evidence and gap maps use systematic, protocol-driven searching and screening similar to systematic reviews, but extract less data because they are not built to synthesize effectiveness.
- 4
Bubble color and size typically communicate evidence type/quality and evidence volume, while clickable bubbles can provide user summaries and links to original sources.
- 5
Maps can identify “absolute gaps” (no studies) and “empty reviews” (systematic reviews without impact evaluations), which can guide commissioning and research priorities.
- 6
Campbell’s mapping work extends beyond effectiveness into areas like process evaluation and country-level evidence inventories, enabling different kinds of evidence architecture decisions.
- 7
Regular updates depend on resources; updating generally requires rerunning searches and recoding newly found studies in the mapping platform.