From Raw Survey & Interview Data to Research Report in Minutes | AILYZE AI Masterclass
Based on Dr Rizwana Mustafa's video on YouTube. If you like this content, support the original creators by watching, liking and subscribing to their content.
Upload survey or interview files, then choose whether to analyze all columns or only selected columns.
Briefing
Turning messy qualitative inputs—survey tables, interview transcripts, and open-ended responses—into a research-ready thematic report is usually a slow, manual grind. This masterclass spotlights AILYZE AI as a workflow that automates the full pipeline: uploading data, detecting numerical vs. categorical vs. text fields, generating themes and sub-themes, coding responses, and producing visuals and copy-pasteable discussion text.
After signing in and choosing “try free now,” the process begins with uploading a file and selecting the analysis mode. For survey data, the tool can analyze all columns or focus on selected columns. It then checks the dataset structure, identifying categorical variables (like product type or status) and separating text data for thematic extraction. Users can either accept AI-generated themes and sub-themes or paste their own thematic framework. The interface supports editing—removing, adding, or reformatting themes—before the system formats them into a list that drives the coding step.
Once themes are set, the tool runs a coding workflow that assigns each row in the spreadsheet to the appropriate theme and sub-theme. The transcript notes that this evaluation can take several minutes (around eight in one example) because the system processes all columns and applies the theme-code mapping across the dataset. The output is not just a list of themes; it generates a structured report that helps write the academic discussion. In the example shown, the discussion ties together multiple themes—personalized relationship, trust, discovery, and social influence—describing how these elements interact to shape contemporary consumer experience.
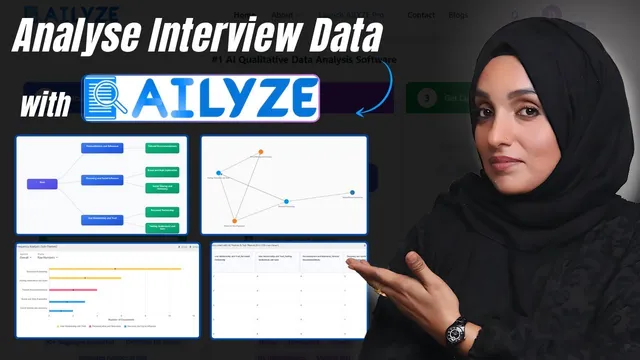
The deliverables extend beyond narrative. The system produces frequency analysis for themes, downloadable high-quality visuals (including hierarchy graphs saved as PNGs), and a coherence view that can also be exported as an image for documents. It also provides coded data mapped to themes and sub-themes, plus recommendations and related quotes pulled from the underlying responses. Those quotes are presented as evidence for each theme, enabling researchers to build a “scientific” discussion without manually hunting for supporting excerpts.
A second workflow targets open-ended interviews. Users upload documents (DOC or PDF), choose an analysis output such as summary, themes/codes, or frequency analysis, and can let AI create themes and codes against questionnaire items. The transcript describes feeding in a set of questionnaire questions (about 15), formatting them into a list, and then applying segments—for example, running analyses by age group and splitting respondents into male and female segments. The tool supports different thematic analysis approaches (including options like code books, grounded theme analysis, and narrative analysis). After submission, results arrive via email with the summary, developed themes and codes, word count, visual graphics, and the relationships between theme codes and survey questions—packaged for direct use in an academic write-up.
Overall, the core claim is practical: AILYZE AI is positioned as a purpose-built assistant for qualitative data analysis that reduces the time and effort required to move from raw interview/survey data to a report with themes, coding, visuals, and quote-backed discussion text.
Cornell Notes
The masterclass presents AILYZE AI as an end-to-end system for qualitative research: upload survey tables or interview documents, detect data types, generate or import themes, and code responses automatically. For surveys, it identifies categorical and text fields, lets users edit theme/sub-theme lists, then codes each spreadsheet row to those categories. The output includes frequency analysis, hierarchy and coherence visuals (downloadable as images), coded datasets, recommendations, and quote-backed evidence that can be pasted into academic discussions. For open-ended interviews, it can create themes and codes against questionnaire items, apply respondent segments (e.g., male/female), and return results with summaries, word counts, visuals, and theme–question relationships via email.
How does the workflow turn a survey spreadsheet into a thematic analysis report?
What kinds of outputs are produced beyond themes and sub-themes?
How does the tool support researcher control over the thematic framework?
How does segmentation work in the interview workflow?
What does the system deliver after submitting an interview analysis?
Review Questions
- When would a researcher choose “analyze all columns” versus “analyze text data in selected columns,” and what data types does the tool identify automatically?
- What steps are involved in moving from a theme list to coded spreadsheet rows, and what kinds of evidence are produced for the discussion?
- In the open-ended interview workflow, how do questionnaire inputs and respondent segments (like male/female) affect the resulting themes and code relationships?
Key Points
- 1
Upload survey or interview files, then choose whether to analyze all columns or only selected columns.
- 2
Let the tool detect numerical, categorical, and text fields to drive the thematic workflow.
- 3
Use AI-generated themes or paste a custom theme/sub-theme framework, then edit the list before coding.
- 4
Run automated coding to assign each spreadsheet row to specific themes and sub-themes, producing quote-backed evidence.
- 5
Export research visuals such as hierarchy graphs and coherence views as images for documents.
- 6
For open-ended interviews, feed questionnaire items, optionally generate themes/codes against those items, and apply respondent segments.
- 7
Receive results via email with summaries, themes, codes, word counts, visuals, and theme–question relationships ready for academic writing.