How to create OKRs
Based on Notion's video on YouTube. If you like this content, support the original creators by watching, liking and subscribing to their content.
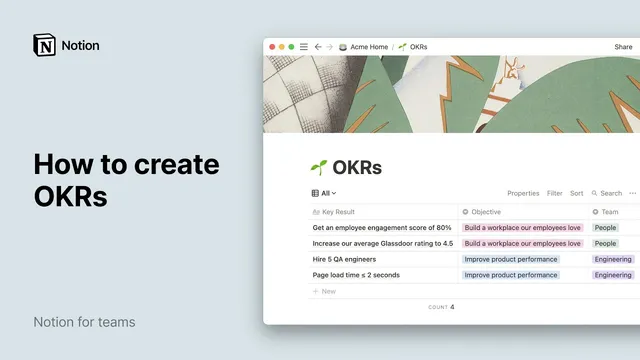
Create a Notion table database for OKRs where each Key Result is stored as its own entry (page) so teams can attach tasks and notes.
Briefing
OKRs become far easier to manage when they live in a single, structured Notion database—complete with measurable progress tracking, multiple filtered views, and linked team pages. The core setup treats an Objective as the destination and each Key Result as a quantifiable outcome, then turns every Key Result into its own database entry so teams can attach context like tasks, notes, and ownership while still seeing progress at a glance.
The build starts by creating a table database in Notion and using the first column to store Key Results. Each Key Result entry can be expanded into its own page, where teams can add supporting material such as action items or meeting notes. To make the system usable across an organization, the database then gains properties that function like the columns of an OKR spreadsheet: three single-select fields for Objective, Team, and Quarter; three number fields for Initial Value, Current Value, and Target Value; and a formula property called Progress that calculates completion as a percentage. The transcript walks through concrete examples—employee engagement moving from 0.66 to 0.73 with a target of 0.8, a Glassdoor rating shifting from 3.7 to 3.9 toward 4.5, QA hiring growing from 0 to 2 with a target of 5, and a performance metric where Current Value already matches Target Value once the goal is achieved.
After progress math is in place, additional properties round out operational tracking: a Person property for the lead, a Date property for the time frame (with start and end dates), and a Last Edited Time property to capture when each Key Result was last updated. With these fields, teams can not only measure outcomes but also see who owns them and how recently they were worked.
The second major step adds database views—different ways of looking at the same underlying OKR data without duplicating it. New views can display only one team’s OKRs (e.g., Engineering or People) using filters on the Team property, or show what a specific manager owns using a dynamic filter like Lead contains me. Additional filtered views can isolate a particular quarter, and a Timeline view can lay Key Results out chronologically for a clearer picture of work over time. In total, the system can produce multiple perspectives—seven views in the example—while keeping the source data consistent.
Finally, the transcript shows how to link the OKR database onto each team’s home page using a linked database. That linked version can be filtered and simplified (including hiding properties) so every team sees only what matters—such as Engineering Key Results for a specific quarter—while edits to the underlying OKR entries remain transparent across teams. The result is a single, measurable OKR system that stays visible, focused, and up to date everywhere teams collaborate.
Cornell Notes
The transcript lays out a practical method for building an OKR system in Notion that tracks measurable progress. It starts with a table database where each Key Result is stored as its own entry and can hold extra context like tasks or meeting notes. The database is expanded with properties for Objective, Team, Quarter, Initial Value, Current Value, Target Value, and a Progress formula that calculates completion percentage. Additional fields capture ownership (Lead), timing (time frame dates), and freshness (last modified time). Multiple filtered views (by team, by lead, by quarter) and a Timeline view let different stakeholders see the same OKR data in the most useful format, and linked databases keep team pages focused while staying synchronized.
How does the setup distinguish an Objective from a Key Result, and why does that matter in the database design?
What properties are needed to compute OKR progress automatically, and what does the Progress formula do?
Why use single-select properties like Objective, Team, and Quarter instead of free text?
How do filtered views help different stakeholders without duplicating data?
What is the purpose of linking the OKR database to team pages, and how do filters and hidden properties work there?
What additional tracking fields make the OKR system operational, not just informational?
Review Questions
- If a Key Result’s Current Value already equals its Target Value, how would the Progress percentage behave under the formula described?
- What combination of properties would you filter on to create a view for a specific team’s OKRs in a specific quarter?
- How does a linked database differ from creating a separate database, and what does that mean for cross-team updates?
Key Points
- 1
Create a Notion table database for OKRs where each Key Result is stored as its own entry (page) so teams can attach tasks and notes.
- 2
Add single-select properties for Objective, Team, and Quarter to enable consistent tagging and reliable filtering.
- 3
Track progress with Initial Value, Current Value, and Target Value number properties, then compute Progress with a formula that converts movement toward the target into a percentage.
- 4
Add ownership and accountability fields—Lead (person), time frame dates, and last modified time—to make OKRs actionable and current.
- 5
Build multiple database views (tables, boards, timelines, lists, galleries) using filters on properties like Team, Lead, and Quarter to tailor dashboards for different stakeholders.
- 6
Use a linked database on team pages to keep OKRs visible and focused; apply filters and hide properties for clarity while ensuring edits remain synchronized with the original database.