How to Deploy LLMs | LLMOps Stack with vLLM, Docker, Grafana & MLflow
Based on Venelin Valkov's video on YouTube. If you like this content, support the original creators by watching, liking and subscribing to their content.
vLLM is used to serve the LLM with higher throughput and paged attention for more efficient GPU memory utilization.
Briefing
Running an LLM locally is only half the job; production needs concurrency, security, monitoring, and a way to detect failures. A practical LLMOps stack built around vLLM delivers those pieces by serving a quantized Hugging Face model behind an Nginx reverse proxy, instrumenting it with Prometheus + Grafana dashboards, and tracking live inference runs in MLflow—then deploying the whole setup on Vast AI via Docker Compose for low hourly cost.
At the core sits vLLM, chosen for higher throughput and efficient GPU serving. The deployment uses the “quentry” family (the transcript names “quentry the 4 billion parameter” and then “quint3 4 billion parameter instruct version” from Hugging Face). A key performance feature is paged attention, described as a memory-efficiency technique akin to Tetris-style space packing, letting the system fit more of the model into limited GPU memory. The stack also constrains runtime risk: it limits GPU memory utilization to 90% and caps the context window to 4,96 tokens (as stated), reducing the chance of out-of-memory crashes. For gated models, a Hugging Face token is passed so vLLM can download weights automatically.
Security and endpoint control come next. Nginx acts as a reverse proxy that sits in front of the vLLM API, enforcing authorization so only requests with the expected token reach the inference service. The transcript notes that the example uses a simple token check (with a warning to replace it with stronger production-grade auth such as OAuth or similar).
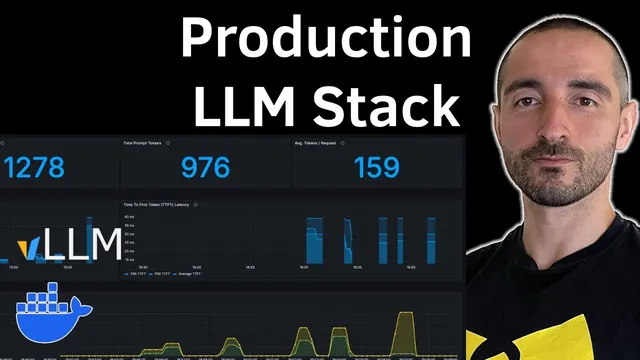
Observability is handled with Prometheus and Grafana. Prometheus scrapes the vLLM metrics endpoint every five seconds (the transcript references vLLM’s default metrics endpoint on port 8000) and stores those time-series metrics. Grafana then visualizes them through dashboards imported from a provided configuration, focusing on latency and throughput indicators such as time to first token, end-to-end request latency, token generation/completion counts, and token throughput. The monitoring window is shown as the last 15 minutes, with the option to extend.
Reliability is addressed with a health check loop. The vLLM container runs a periodic check every 30 seconds by calling the vLLM health endpoint with a 50-second timeout, delayed by a start period of 300 seconds to allow model download and initialization.
For experiment tracking, MLflow is added to observe inference quality and performance at the conversation level. The workflow uses LangChain to call the vLLM service through an OpenAI-compatible interface (the transcript says vLLM can simulate an OpenAI server). In the demo, each chat request is logged to MLflow with request/response details and token counts, and a new MLflow experiment appears (named “conversation” in the transcript) with a timeline of inputs and outputs.
Deployment is orchestrated with a single Docker Compose file and executed on Vast AI. The process includes selecting a GPU instance (the transcript cites a 3090 at about 28 cents), SSH-ing into the provisioned machine, cloning the repository, inserting the Hugging Face token, and running docker compose up to pull images, download model weights, and start the vLLM server. Once running, Prometheus and Grafana begin collecting metrics, and the LangChain + MLflow client can generate requests against the secured public API. The result is an end-to-end LLMOps stack aimed at production readiness: concurrency-friendly serving, basic access control, continuous monitoring, and structured inference logging.
Cornell Notes
The stack turns a local LLM into a production-style service by combining vLLM, Nginx, Prometheus, Grafana, and MLflow. vLLM provides high-throughput inference and efficient GPU memory use via paged attention, while runtime safeguards limit GPU memory to 90% and cap the context window (4,96 tokens as stated). Nginx sits in front to enforce authorization before requests reach the vLLM API, and a health check endpoint helps detect startup or runtime issues. Prometheus scrapes vLLM metrics every five seconds and Grafana renders dashboards for latency and token throughput. LangChain sends chat requests through an OpenAI-compatible base URL, and MLflow logs each conversation’s request/response and token counts for later inspection.
Why is vLLM positioned as the inference engine in this LLMOps stack?
How does the stack reduce the chance of GPU-related crashes during inference?
What role does Nginx play, and what security caveat is mentioned?
How do Prometheus and Grafana work together to monitor the running model?
How does MLflow fit into the inference workflow?
What does the deployment process on Vast AI look like at a high level?
Review Questions
- Which specific vLLM configuration choices in the transcript are meant to prevent out-of-memory failures, and how do they relate to context length and GPU memory utilization?
- How does the stack ensure that only authorized requests reach the inference service, and what production-hardening step is recommended?
- What metrics does Grafana visualize in the described dashboard, and how does Prometheus’s scraping interval affect the monitoring granularity?
Key Points
- 1
vLLM is used to serve the LLM with higher throughput and paged attention for more efficient GPU memory utilization.
- 2
Nginx provides a reverse-proxy layer that enforces token-based authorization before requests reach the vLLM inference API.
- 3
Prometheus scrapes vLLM metrics every five seconds, and Grafana turns those metrics into dashboards focused on latency and token throughput.
- 4
Health checks call the vLLM health endpoint every 30 seconds after a 300-second startup delay to catch failures early.
- 5
GPU stability is improved by capping GPU memory utilization at 90% and limiting the context window to 4,96 tokens (as stated).
- 6
MLflow logs each conversation’s request/response and token counts, enabling experiment tracking alongside live inference.
- 7
Docker Compose packages the entire stack for deployment on Vast AI, including model download, container startup, and metrics/observability services.