How to Devour a Research Paper in Seconds | Fast and Easy Technique!
Based on Andy Stapleton's video on YouTube. If you like this content, support the original creators by watching, liking and subscribing to their content.
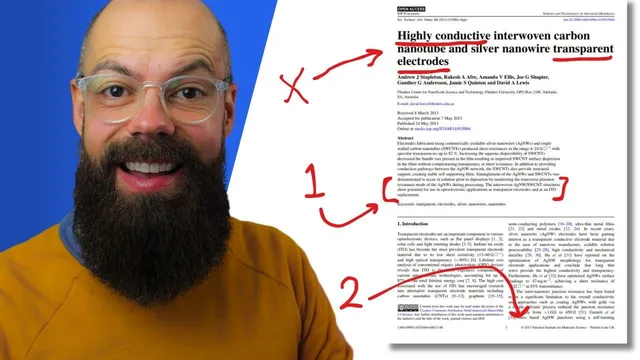
Start at the bottom of the abstract to capture the paper’s highest-signal “crux” before reading the rest.
Briefing
A fast way to decide whether a scientific paper is worth time starts at the bottom of the abstract: the last sentences often contain the “crux” that determines what the work really is and why it matters. Instead of reading titles, author lists, and the surrounding filler, the method targets the back end of the abstract where the key finding is usually compressed into a single high-signal statement. In one example, the decisive line points to a fabrication approach—silver nanowire and carbon nano–PSS electrode work enabling lower-temperature, healing-free devices—so the reader immediately knows what kind of contribution is being claimed. Another example uses a take-home phrasing about a nanocomposite electrode enabling highly flexible organic photovoltaic devices with performance up to 90% of control efficiencies, again letting the reader quickly judge relevance.
Once that quick abstract scan sparks interest, the next step is to move through figures rather than text. The approach treats figures as self-contained evidence: a strong figure usually has a caption that clarifies what’s being shown, and the reader can infer meaning from familiar visual cues. The workflow is practical—start with figures that match the paper’s purpose (for a fabrication-focused study, look for fabrication-relevant visuals), then scan for key experimental readouts such as SEM, AFM, transmission spectra, and JV curves. When unfamiliar labels appear (for instance, “T over R” or Raman-related plots), the reader follows the trail by checking figure captions or searching within the document for the relevant term (e.g., “Ramen”/Raman). The goal is not full mastery on the first pass; it’s extracting the results that define performance, mechanism, and novelty.
After the figure sweep, the method narrows further by checking the conclusions—especially the last paragraph, which often contains the application, novelty, or “cheeky take-home message” the authors want retained. This is where the reader confirms whether the paper is something to understand deeply for future work or merely something citable for later. A second example on graphene thickness measurement illustrates the same logic: the reader skips the title and focuses on the key finding section, then uses figure evidence to interpret claims such as single-layer height measurements around 1.25–1.5 nanometers, supported by Raman (e.g., G-band intensity) and AFM height data. The conclusions then connect the dots, such as identifying applied pressure as a key parameter.
Beyond results, the method includes targeted “cheat moves.” The introduction is treated as optional unless entering a new field; in early-stage projects it functions like a compact literature map, but later it’s often redundant. Methods are largely skipped unless replication is required, since they matter most when attempting the exact procedure. Author names become more important over time as familiar researchers signal credibility and relevance in a niche.
Finally, the technique recommends converting the most useful figures and schematics into a personal slide in PowerPoint, paired with a one- or two-sentence takeaway—often lifted from the final abstract lines—so the key message can be reviewed quickly later. The overall principle is selective reading: memorize only what’s necessary, and use a structured scan to decide what deserves deeper attention.
Cornell Notes
The quickest way to assess a research paper is to read the last part of the abstract, where the highest-signal “crux” usually appears. If that takeaway matches the reader’s interests, the next pass focuses on figures—using captions, familiar visual types (SEM, AFM, JV curves), and targeted searches for unfamiliar terms like Raman. After extracting results, the reader checks the conclusions, especially the final paragraph, to confirm the paper’s novelty, application, and whether it’s worth deeper understanding or just citation. Methods and introductions are treated as conditional: read them when entering a new field or when replication is needed; otherwise, skip to save time. The process ends with saving key figures/schematics into a PowerPoint slide with a short takeaway for fast later review.
Why does the method start at the bottom of the abstract instead of the beginning?
How does scanning figures replace reading text during the first pass?
What should a reader do when a figure includes unfamiliar labels or terms?
How does the conclusions section function in this workflow?
When should introductions and methods be read instead of skipped?
What’s the practical output step after scanning—how does it help long-term?
Review Questions
- When deciding whether to read a paper deeply, what two sections does this method prioritize first, and what specific information is sought in each?
- How does the figure-scanning approach handle unfamiliar concepts like Raman or unclear plot labels?
- Under what circumstances does the method recommend reading the introduction and methods sections rather than skipping them?
Key Points
- 1
Start at the bottom of the abstract to capture the paper’s highest-signal “crux” before reading the rest.
- 2
Use figures as the primary evidence during an initial scan, relying on captions and familiar figure types (SEM, AFM, JV curves, transmission spectra).
- 3
When encountering unfamiliar terms or labels, resolve them by checking captions and searching within the document for the relevant keyword (e.g., Raman).
- 4
Treat the conclusions—especially the last paragraph—as the final decision point for novelty, application, and whether the paper merits deeper study.
- 5
Skip introductions and methods by default, but read the introduction when entering a new field and read methods when replication is required.
- 6
Convert key figures/schematics into a personal PowerPoint slide with a short takeaway to enable fast later review.