KGC 2022: 'UBS Knowledge Graph — Connecting The Banks Data' by Gregor Wobbe
Based on The Knowledge Graph Conference 's video on YouTube. If you like this content, support the original creators by watching, liking and subscribing to their content.
UBS’s knowledge graph initiative began with a CRM counting question that exposed ambiguous definitions and disconnected cost data across warehouses.
Briefing
UBS’s knowledge graph push grew out of a simple executive question—how many CRM applications exist—and exposed a deeper problem: data was trapped behind thousands of “walled garden” systems, with unclear definitions and costly integration. The initiative’s core finding is that a next-generation data platform needs both a shared, unambiguous data model and a scalable way to connect many legacy domains without forcing every application to be rebuilt.
The starting point was a counting exercise in the CRM space. Teams tried to pull numbers from central stores and source-system ETL jobs, but the effort stalled in interpretation disputes and organizational misalignment. Even once a number was produced, the follow-up question about cost landed in a different warehouse, reinforcing that “one interpretation” was impossible with the existing landscape. UBS then defined a “nirvana state”: an analytical layer with a well-described data layer that a motivated non-technical person could understand quickly, plus an environment where data scientists spend less time hunting and massaging data and more time generating insights.
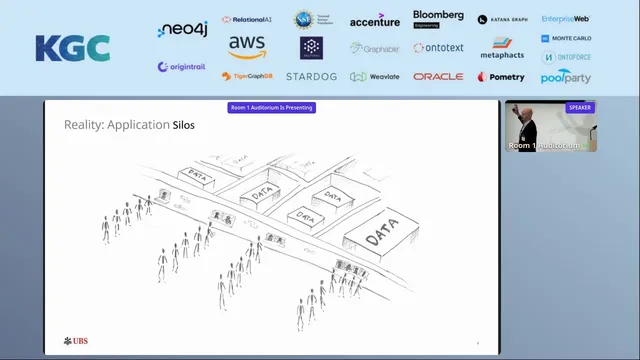
Reality looked different. Over decades, UBS accumulated roughly 5,000 applications, each guarded by application owners who had little incentive to expose data. Access required navigating gatekeepers and cross-border constraints, while integration work consumed the majority of effort. UBS estimates that when a new application is stood up, about 60% of costs go to enterprise integration. More integrations meant more code, which translated into higher maintenance burden and growing technical debt.
To change that trajectory, UBS reframed the platform as two connected moves: use graph technology to represent data consistently, and move away from “build one thing to rule them all” toward a decentralized approach. Graphs were chosen because they can represent both tabular relationships and other data forms in a common structure; UBS also settled on RDF for a single, extensible data model, despite internal debates. The platform’s other pillar is a custom “data service,” treated like a reusable cell: each application gets its own data service that can “hoover up” source data into connected data and/or expose it through a UI.
This design aims to scale across domains and data lakes by enabling “double-hop” questions—like counting CRM systems and estimating cost—to be answered without bespoke, one-off integrations. In practice, UBS runs publishers and consumers through data services deployed on Kubernetes, allowing the system to scale with cloud capacity.
A flagship “lighthouse” prototype, “bank on a page,” gives an interactive bird’s-eye view of the application estate. Users can apply lenses to filter by business capability (e.g., CRM), identify end-of-life software, or surface security exposure such as Log4j vulnerabilities—pulled from multiple vulnerability management systems. UBS also learned that not everything belongs in a graph: high-volume trading data is streamed via Kafka, with JSON Schema annotations linked to an internal schema.org so data remains explainable without forcing graph modeling.
The rollout strategy emphasized incremental delivery: demonstrate small, single-domain wins every two weeks; invest heavily in a visual anchor and UX (including a dedicated UX developer); and limit technical jargon when selling to stakeholders. Follow-up Q&A highlighted governance challenges around reconciling shared concepts (like currency) and the plan to incentivize data sharing through “data as a product” rewards. Legacy systems are not being discarded; they’re being used as sources while the platform acts as glue across the enterprise.
Cornell Notes
UBS’s CRM “how many applications?” problem exposed how unclear definitions and guarded systems make data hard to count, cost, and reuse. The response was a next-generation data platform built on two ideas: represent data with graph-friendly modeling (RDF) and connect domains through a decentralized “data service” per application. Each data service can ingest source data into connected data and expose it to consumers, enabling cross-domain queries without rebuilding every integration. A Kubernetes-based architecture scales publishers and consumers, while Kafka plus JSON Schema handles high-volume trading data without forcing it into a graph. Incremental rollout—single-domain demos, strong UX, and minimal jargon—helped earn buy-in and momentum.
Why did a simple CRM counting question become a catalyst for a knowledge graph initiative?
What does UBS mean by a “well-described data layer,” and why does it matter?
How does the “data service” support decentralized integration across thousands of applications?
Why did UBS choose graph modeling and RDF despite internal debate?
Where does UBS draw the line on using a graph?
What governance and reconciliation challenges surfaced in Q&A, and what’s the direction?
Review Questions
- What specific failure modes in the CRM counting exercise motivated UBS’s “well-described” and “unambiguous” data-layer goals?
- How does the per-application data service architecture reduce integration costs compared with traditional enterprise integration approaches?
- Give one example of where UBS chose graph modeling and one where it chose Kafka + JSON Schema, and explain the tradeoff behind each choice.
Key Points
- 1
UBS’s knowledge graph initiative began with a CRM counting question that exposed ambiguous definitions and disconnected cost data across warehouses.
- 2
A “nirvana state” was defined: a well-described, unambiguous data layer that non-technical stakeholders can understand quickly, plus data access that reduces data scientists’ time spent on hunting and reshaping.
- 3
The platform targets two root causes of cost: guarded access to data and expensive enterprise integration, estimated at ~60% of new-application costs.
- 4
UBS’s architecture combines graph-friendly modeling (RDF) with a decentralized “data service” per application to connect domains without rebuilding every integration.
- 5
Kubernetes is used to scale data services for both publishers and consumers, supporting enterprise-wide connectivity.
- 6
High-volume trading data is kept out of graph modeling; Kafka streams it while JSON Schema annotations link back to an internal schema.org for explainability.
- 7
Rollout success depended on incremental, single-domain demos, a strong visual anchor (“bank on a page”), and limiting technical jargon to match stakeholder expectations.