Lab 04: Experiment Management (FSDL 2022)
Based on The Full Stack's video on YouTube. If you like this content, support the original creators by watching, liking and subscribing to their content.
Training metrics printed to the console are not enough; without persistent logs and metadata, experiments can’t be reliably reproduced or compared.
Briefing
Experiment management is the difference between “useful training output” and “lost knowledge.” During model training, metrics like loss and validation accuracy stream to the command line, but without structured logging those numbers get overwritten, vanish when the notebook restarts, and make it impossible to reconstruct which hyperparameters, git state, or timestamps produced a given result. The lab frames this as a core engineering need: preserve metrics over time and attach the surrounding context—code version, system details, and other metadata—so experiments can be compared, debugged, and improved.
TensorBoard is introduced as the traditional baseline for tracking training curves. It runs as a separate service and visualizes logged metrics as charts over time, which works well for inspecting a single run. But once multiple experiments enter the picture, the workflow becomes harder: comparing across runs and managing the lifecycle of the logging service adds friction, and the setup can distract many ML engineers from building models and products.
Weights & Biases (W&B) is presented as the recommended upgrade for experiment management, largely because it integrates smoothly with popular deep learning stacks (including PyTorch Lightning, Keras, and TensorBoard) and improves both the logging experience and the interface for reviewing results. The integration can be added to an experiment script with only a handful of lines, and the lab walks through what those additions unlock in the W&B web UI while training is still running. Metrics update live, and the run page is organized into tabs that separate concerns: an Overview tab for run metadata (start time, duration, OS/Python version, git repository state, command-line arguments, and final metrics), a System tab for CPU/GPU utilization and memory (useful for catching performance regressions), a Model tab enabled by a single watch call, a Logs tab capturing terminal output, and a Files tab that includes environment snapshots and diffs against version control.
W&B also adds higher-value artifacts and reproducibility features. The Artifacts tab stores generated binaries such as model checkpoints and input/output media from the text recognizer, versioned like directories with lineage tracking. The lab highlights that these artifacts can be tagged (for example, “best” checkpoints via PyTorch Lightning callbacks), and that W&B can track which runs created or consumed which artifacts—critical for debugging and for tracing model behavior back to data and code.
Beyond browsing, the lab emphasizes programmatic access via the W&B API, enabling workflows like pulling logged tables into pandas, analyzing augmented data samples, and traversing the run→artifact→run graph to diagnose issues in data processing pipelines. Because raw logs can become overwhelming, W&B Reports are introduced as a way to package results into shareable, structured dashboards and PR-friendly summaries, linking metrics back to git changes.
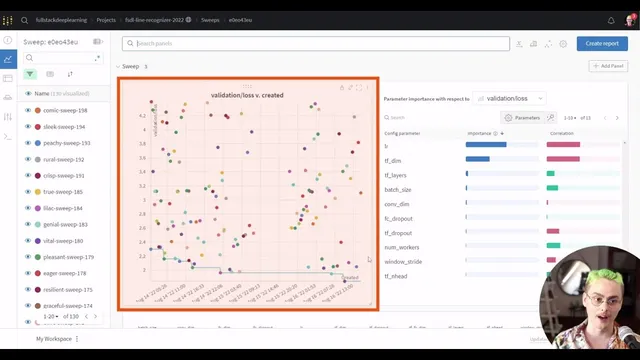
Finally, the lab scales from single experiments to large projects and hyperparameter optimization. It demonstrates filtering and custom charts across many runs (including derived metrics like generalization gap) and shows how W&B can orchestrate hyperparameter sweeps using a YAML-configured controller with lightweight agents. The exercises encourage contributing to a massive sweep, exploring the W&B SDK for manual logging, searching for better hyperparameters for a line CNN transformer, and extending metrics logging using torchmetrics—turning experiment tracking into a repeatable, collaborative development loop.
Cornell Notes
Experiment management preserves training knowledge that would otherwise disappear—metrics, hyperparameters, git state, system details, and generated artifacts—so results can be compared and reproduced. TensorBoard can visualize metrics for a single run, but it becomes cumbersome when many experiments must be sliced, filtered, and shared. Weights & Biases (W&B) improves the workflow with tight integrations (notably PyTorch Lightning), live-updating dashboards, and structured tabs for run metadata, system utilization, logs, files, and versioned artifacts like checkpoints and model I/O. W&B also supports programmatic access through an API and uses Reports to package results for PRs and stakeholders. The lab extends these ideas to large-scale projects and hyperparameter sweeps using W&B agents and YAML configuration.
Why does experiment management matter even when training already prints metrics to the console?
What specific limitations of TensorBoard show up once multiple experiments need comparison?
What does W&B add beyond metric charts, and how do the run tabs map to different debugging needs?
How do W&B artifacts and lineage help track model checkpoints and their provenance?
How does W&B’s API change what teams can do with logged experiment data?
What workflow does W&B support for hyperparameter optimization at scale?
Review Questions
- How would you reconstruct the exact conditions of a past training run if the notebook output was lost—what metadata must have been logged?
- Compare TensorBoard and W&B in terms of multi-experiment comparison, collaboration, and reproducibility features.
- In a W&B project with many runs, how would you use derived metrics (like generalization gap) and filtering to identify overfitting patterns?
Key Points
- 1
Training metrics printed to the console are not enough; without persistent logs and metadata, experiments can’t be reliably reproduced or compared.
- 2
TensorBoard is effective for single-run visualization but becomes less practical when many experiments must be grouped, filtered, and managed.
- 3
Weights & Biases improves experiment management with live dashboards, structured run tabs (Overview/System/Logs/Files/Artifacts), and strong integrations with PyTorch Lightning and other frameworks.
- 4
Versioned artifacts (checkpoints and model I/O) plus lineage tracking make it possible to trace model outputs back to the exact training runs and code states.
- 5
The W&B API enables deeper analysis by pulling logged tables into tools like pandas and traversing the run/artifact dependency graph.
- 6
W&B Reports help turn raw experiment logs into shareable dashboards and PR-linked summaries that reduce confusion for reviewers and stakeholders.
- 7
W&B hyperparameter sweeps use YAML-configured controllers and agent workers, making large-scale search and multi-GPU parallelization straightforward.