Logseq Whiteboards Demo (+ Q&A)
Based on Logseq's video on YouTube. If you like this content, support the original creators by watching, liking and subscribing to their content.
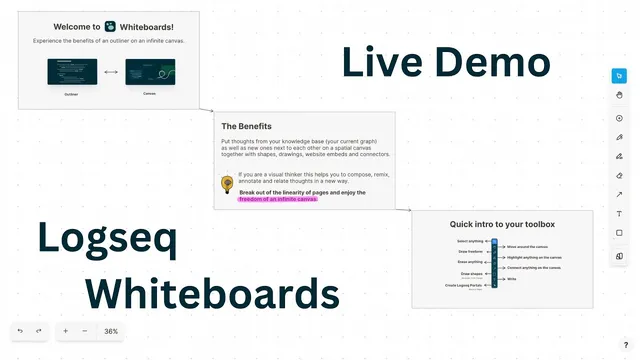
Whiteboards extends Logseq’s outliner into a spatial canvas to represent relationships through layout, proximity, and links rather than linear text alone.
Briefing
Logseq’s upcoming Whiteboards feature aims to fix a core limitation of outliner-style note apps: they help people structure ideas linearly, but they struggle to represent how thoughts relate in space. The Whiteboards MVP—launching next week—extends Logseq’s outliner into a spatial canvas where blocks and pages can be visually grouped, linked, annotated, and remixed with drawings and external media. The goal is to make “sense making” feel natural: connections become visible through proximity, lines, and layout rather than buried in text.
Logseq’s team frames the move as a response to user research and community feedback, including long-running critiques from visual thinkers. In outliners, structuring talks and essays can feel constrained because the workflow stays linear. Whiteboards introduces a canvas layer that still respects Logseq’s block-based foundation, but adds the spatial affordances associated with memory-palace-style learning: arranging elements in two dimensions helps the brain retain and connect information. The feature is designed to support knowledge work beyond personal note-taking—meetings, work logs, idea capture, diagramming, mood boards, and visual wiki-like study.
The MVP focuses on frictionless creation and fast linking rather than heavy drawing customization. Users can drag and drop blocks and pages from the existing graph into the canvas, and those elements remain usable as first-class Logseq items: they can open in the right sidebar or as pages, and they participate in search. Canvas elements also support block/page references, with visual “live copies” and backlink behavior so users can trace where a canvas element points. Visual styling is included at the card level, such as changing background colors for cards and shapes.
What users seem to value most in the current stage is the freeform canvas that makes relationships easy to express. Common workflows include mind mapping with arrows and embedded content, annotating screenshots for design and front-end tasks, and building flow charts to reason about causes and complex systems. Nested whiteboards are positioned as a way to manage complexity by embedding one board inside another.
A standout use case is studying with Logseq’s existing tools. Users combine the PDF reader and annotation features with the canvas and the outliner sidebar to keep reading context while building a visual network of concepts. One highlighted example is Brian Santa, who organizes Stanford computer science course materials into the outliner, then uses whiteboards to connect slides, handouts, and recommendations—while the PDF reader highlights relevant sections as the canvas links them.
The Whiteboards roadmap includes improving UI quirks, strengthening mobile and stylus/touch input (especially on iPad), and enhancing how whiteboard elements appear in the outliner (including previews). The team also plans publishing capabilities so users can share lecture-style whiteboards. Longer term, Whiteboards is treated as an artifact-creation pipeline: users should be able to move from canvas exploration back into outline or document modes.
In Q&A, the team clarifies that Whiteboards is built on top of TL Draw, a spatial canvas toolkit designed for embedding and customization. Collaboration and real-time team graphs are not prioritized for the MVP; the focus is single-user integration with the personal graph. Interoperability is possible via exporting the underlying EDN representation of a whiteboard, though references may break if linked items don’t exist in the recipient’s graph. The broader market outlook is convergence: canvas tools and outliner tools are increasingly borrowing each other’s interface paradigms, and 2023 is framed as a year when canvas affordances may become standard across note-taking software.
Cornell Notes
Logseq’s Whiteboards feature brings a spatial canvas to an outliner-first workflow, aiming to make connections visible through layout, proximity, and links rather than forcing everything into linear text. The MVP, launching next week, lets users drag and drop blocks and pages onto a canvas, embed media, draw relationships, and keep elements searchable and referenceable inside Logseq. A key design choice is frictionless creation: fast entry, quick linking, and minimal early emphasis on advanced drawing customization. Users already rely on Whiteboards for mind maps, screenshot annotation, flow charts, and—most notably—studying by combining PDFs, annotations, and the outliner with a visual network of concepts. Longer-term plans include better mobile/stylus support, whiteboard previews inside the outliner, publishing, and eventually moving from canvas back to outline/document modes.
Why does Logseq add a canvas to an outliner, and what problem does it target?
What does the Whiteboards MVP prioritize, and what does it intentionally defer?
How do canvas elements stay connected to Logseq’s existing structure (blocks, pages, and search)?
What real-world workflows show the most value for Whiteboards?
How does the linking feature work, and why does it matter?
What are the plans and constraints around collaboration and interoperability?
Review Questions
- How does Whiteboards preserve Logseq’s block/page model while adding spatial grouping and visual linking?
- Which studying workflow combines PDFs, annotations, the outliner, and the canvas, and what does the spatial layout contribute to learning?
- What trade-offs does the team make in the MVP regarding drawing customization, mobile/touch input, and real-time collaboration?
Key Points
- 1
Whiteboards extends Logseq’s outliner into a spatial canvas to represent relationships through layout, proximity, and links rather than linear text alone.
- 2
The MVP launching next week emphasizes frictionless creation and fast linking, not advanced drawing customization.
- 3
Blocks and pages dragged onto the canvas remain first-class Logseq items: they can open in the right sidebar/page view and stay searchable.
- 4
Canvas elements support block/page references with backlink behavior, enabling visual wiki-style navigation between diagrams and documentation.
- 5
Common uses include mind maps, screenshot annotation, flow charts, nested boards for complex topics, and especially studying with PDFs and annotations.
- 6
Whiteboards is built on TL Draw, enabling embedding and customization while Logseq controls the integration and workflow.
- 7
Collaboration and real-time team graphs are deferred; interoperability is possible via EDN export, though cross-graph references may not always survive.