Manifolds 40 | Integral Over A Chart Is Well-Defined
Based on The Bright Side of Mathematics's video on YouTube. If you like this content, support the original creators by watching, liking and subscribing to their content.
A chart-based definition of the integral of a volume form Ω uses the chart’s coordinate expression of Ω and reduces the problem to an ordinary ℝ^n integral.
Briefing
A manifold integral defined using a single coordinate chart turns out not to depend on which orientation-preserving chart is chosen. The key result is that switching charts changes the coordinate expression of the volume form in exactly the way needed for the ordinary multivariable integral to stay the same—so the “integral of a volume form over a manifold” is well defined.
The setup starts with an orientable n-dimensional manifold and a volume form Ω. On a chosen chart H: U → ℝ^n, Ω has a local coordinate representation: a scalar component function (the coefficient of dx1∧…∧dxn) times the standard coordinate n-form. That scalar function is what gets integrated. Concretely, the integral over the chart is defined as an ordinary integral over the image H(U) ⊂ ℝ^n of the component function, equivalently written as ∫_{U} F^*Ω where F is the inverse chart map.
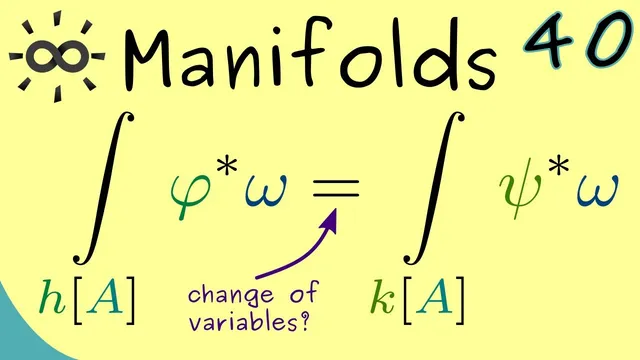
The central question then becomes: what happens if Ω is computed using a different orientation-preserving chart K: U → ℝ^n? On the overlap of two charts, there are two coordinate descriptions of the same region A ⊂ U. The overlap induces a transition map W between the two ℝ^n coordinate systems (a diffeomorphism between open subsets of ℝ^n). The proof reduces to showing that the integrals computed via the two pullbacks agree on A.
To do this, the argument introduces the pullback volume form on ℝ^n, denoted Ω̃ (Omega Tilda), obtained from Ω under one chart. Any volume form on ℝ^n can be written as G(Y) times the standard determinant form; here G is the scalar component function and Y is the ℝ^n coordinate. Pulling Ω̃ back along the transition map W changes the volume form by a Jacobian determinant factor: the determinant of D W(X) multiplies the form. Orientation preservation matters: because the charts preserve orientation, det(DW) is positive, so the absolute value issue in the change-of-variables formula does not introduce sign flips.
With that transformation law in hand, the integral on one coordinate side is rewritten as an integral over the other side using the standard substitution rule for multivariable calculus. The Jacobian determinant from the pullback matches the Jacobian determinant from the change-of-variables theorem, so the scalar density G transforms correctly and the resulting integral becomes ∫ G(Y) dY in both coordinate descriptions. Since the two chart computations yield the same value on every overlap region A, the manifold integral defined from Ω is independent of the chosen orientation-preserving chart.
The upshot is a clean consistency check: the abstract definition of integrating a volume form over an orientable manifold can be reduced to ordinary ℝ^n integration in any chart, and chart changes only re-express the integrand through the Jacobian in a way that leaves the final number unchanged. The next step, hinted at for later, is extending this well-definedness from single charts to the entire manifold by patching across an atlas.
Cornell Notes
The integral of a volume form Ω on an orientable manifold is defined using a single orientation-preserving chart by pulling Ω back to ℝ^n and integrating the resulting scalar density. The main concern is whether switching to another orientation-preserving chart changes the value. On chart overlaps, the two coordinate descriptions are related by a transition map W between open subsets of ℝ^n. Pulling the ℝ^n volume form through W multiplies it by det(DW), and the multivariable change-of-variables formula contributes the same Jacobian factor. Because orientation preservation ensures det(DW) > 0, no sign ambiguity appears, so the integrals match. Therefore the chart-based definition is well defined.
How is the manifold integral of a volume form Ω turned into an ordinary ℝ^n integral on a chart?
What role does the transition map W play when two charts overlap?
Why does the determinant of the Jacobian appear when changing charts?
How does the multivariable change-of-variables formula finish the argument?
Why is orientation preservation essential in this proof?
Review Questions
- On an overlap of two orientation-preserving charts, what map relates the two ℝ^n coordinate descriptions, and how does it enter the integral?
- Explain how pulling back a volume form on ℝ^n along a diffeomorphism produces a Jacobian determinant factor.
- What specific condition on the transition map prevents sign ambiguity in the change-of-variables step?
Key Points
- 1
A chart-based definition of the integral of a volume form Ω uses the chart’s coordinate expression of Ω and reduces the problem to an ordinary ℝ^n integral.
- 2
On overlaps of two charts, the two coordinate descriptions are related by a transition map W between open subsets of ℝ^n.
- 3
Pulling back an ℝ^n volume form along W multiplies it by det(DW), reflecting how n-dimensional oriented volume scales under coordinate change.
- 4
Orientation-preserving charts ensure det(DW) > 0, so the Jacobian sign does not cause discrepancies.
- 5
The multivariable change-of-variables formula matches the Jacobian factor introduced by the pullback, making the two chart computations equal.
- 6
Because the equality holds on every overlap region, the integral defined via charts is well defined (independent of the chosen orientation-preserving chart).