ML Monitoring CS329S Machine Learning Systems Design Stanford by guest Alessya Visnjic (WhyLabs)
Based on WhyLabs's video on YouTube. If you like this content, support the original creators by watching, liking and subscribing to their content.
Treat telemetry as the limiting factor for ML observability: missing or poorly designed telemetry constrains drift detection and root-cause capabilities.
Briefing
Machine learning observability hinges on one practical bottleneck: telemetry. Alyssa Visnjic argues that if teams don’t capture the right “vitals” quickly, extensibly, and cheaply enough, everything downstream—drift detection, dashboards, alerts, and root-cause workflows—gets constrained by what was (or wasn’t) recorded. In production, those vitals must also fit into a larger system of upstream data sources and downstream consumers, while meeting business realities like latency, scale, operating cost, and long-term maintenance.
The talk frames monitoring as a three-step loop: collect pipeline vitals, detect changes, and involve humans (or automate) when something shifts. That loop becomes harder once an ML service sits inside a “breathing” software ecosystem where upstream inputs and downstream outputs interact. Monitoring tools must therefore understand cross-system dependencies, and they can’t be more expensive to run than the ML product they protect. Visnjic also draws a sharp distinction between monitoring and observability: monitoring often stops at detection and notification, while observability pulls relevant context together and correlates signals to help teams root-cause faster—especially when data drift or data quality issues appear.
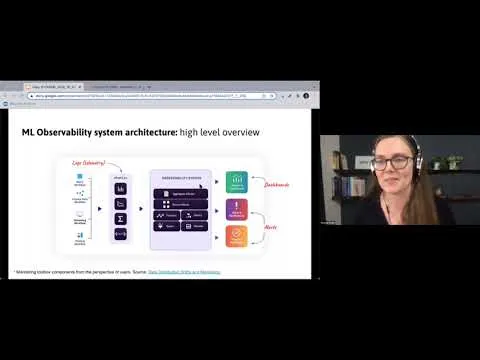
To make that distinction concrete, she uses an observability architecture built around logs, dashboards, and alerts. Telemetry feeds the system; processed outputs become dashboards for rapid investigation and alerts for timely intervention. Alerts can also trigger automation—such as kicking off retraining when distribution drift crosses a threshold, or halting predictions when data quality degrades (for example, when a large fraction of features become null). A recurring operational theme is alert fatigue: systems that cry wolf lose credibility, while systems that stay silent fail when it matters. The balance requires careful tuning by the people who built and operate the system.
From there, the talk zooms into what telemetry should include for ML. Visnjic defines telemetry broadly as all information that can describe the state of an ML application, organized into “profiles,” where a profile is a unit of time (e.g., an hour or a day). Profiles must be comparable across time windows to support learning-based monitoring. Key telemetry categories include lineage metadata (model versions, hyperparameters, and artifacts), schema (data shapes across the feature pipeline), counts and statistics (missing values, run counts, prediction counts), and distribution summaries of inputs and outputs to detect distribution drift. Resource telemetry like CPU and memory during training is also useful for diagnosing bottlenecks and failures.
To address the tedious, error-prone work of defining telemetry schemas, Visnjic introduces WhyLabs’ open-source library, ylogs, designed to capture ML telemetry profiles efficiently. The library emphasizes simplicity and integration (e.g., logging from a dataframe in one line), lightweight production performance (built on streaming-friendly techniques such as Apache DataSketches), and mergeable, map-reducible statistics so distributed or micro-batched computation can be combined into day- or hour-level profiles. A key claim is that it can process 100% of data in a streaming fashion rather than sampling—important for avoiding false alarms from misestimated long-tail distributions.
The final segment demonstrates the workflow: profiles are generated locally from a public Lending Club dataset segmented into seven days, then uploaded to the WhyLabs enterprise platform for dashboarding and monitoring. A sample monitor computes distribution distance using Hellinger distance and tracks metrics like medians and “busy values,” producing an alert when missing values spike on a later day—without hand-tuning per-feature thresholds. The platform supports configurable baselines and alert behavior, and the system can be operated via API for enterprise-scale ingestion across many models.
Cornell Notes
The core message is that ML observability depends on high-quality telemetry: if the system doesn’t capture the right ML “vitals” as time-based profiles, drift detection and root-cause workflows will be limited. Visnjic frames monitoring as collecting vitals, detecting changes, and escalating or automating responses, while observability goes further by correlating signals to help teams understand why changes happen. For ML telemetry, she highlights lineage metadata, schema across the feature pipeline, counts/statistics (e.g., missing values), and distribution summaries of inputs/outputs, organized into comparable time windows (“profiles”). She then presents ylogs, an open-source library that builds mergeable streaming statistics (based on Apache DataSketches) so production pipelines can log telemetry cheaply and accurately without sampling long-tail data. A demo shows profiles uploaded to WhyLabs to power dashboards and alerts, including distribution-distance-based drift detection using Hellinger distance.
Why does telemetry quality determine how well an ML observability system works in practice?
How does the talk distinguish monitoring from observability at the system level?
What does “profiles” mean in ML telemetry, and why must profiles be comparable over time?
What categories of telemetry are recommended for ML systems?
What design choices make ylogs suitable for production-scale telemetry capture?
How does the demo detect drift and generate an alert?
Review Questions
- What production constraints (cost, latency, scale, maintenance) does the talk say telemetry must satisfy, and why do they matter for observability outcomes?
- How do lineage metadata, schema, and distribution summaries each contribute to diagnosing drift or data quality problems?
- Why is avoiding sampling emphasized for long-tail distributions, and how do mergeable streaming statistics help?
Key Points
- 1
Treat telemetry as the limiting factor for ML observability: missing or poorly designed telemetry constrains drift detection and root-cause capabilities.
- 2
Model monitoring as a loop—collect vitals, detect change, then escalate to humans or automate actions when thresholds are crossed.
- 3
Design telemetry around ML-specific context: lineage metadata, schema across the feature pipeline, counts/statistics, and distribution summaries of inputs/outputs.
- 4
Organize telemetry into comparable time-based profiles so baselines and test windows can be meaningfully compared over time.
- 5
Use streaming, mergeable statistics to keep production overhead low and to support distributed computation without moving large datasets.
- 6
Avoid sampling when estimating distributions with long tails to reduce false alarms from misestimated rare events.
- 7
Tune alerting carefully to prevent alert fatigue; alerts must match the needs of the people who operate the system.