Monitoring (6) - Testing & Deployment - Full Stack Deep Learning
Based on The Full Stack's video on YouTube. If you like this content, support the original creators by watching, liking and subscribing to their content.
Monitor system health for the serving layer using CPU, memory, request volume, latency, and error rate, and set actionable alarms with time windows.
Briefing
Monitoring for machine learning deployments isn’t just about keeping servers alive—it’s about catching data and model failures early, then feeding those failures back into training so performance improves over time. At the infrastructure level, monitoring typically tracks CPU load, memory usage, request counts, and request latency, while also logging error rates. Teams set alarms such as “error rate above 1% for more than a minute,” then store historical metrics to verify whether a change actually improved response time or reliability.
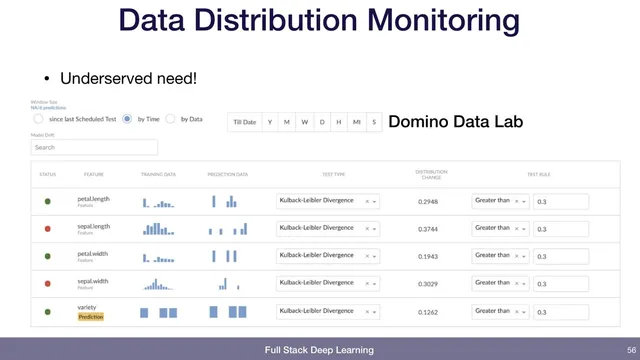
That same monitoring mindset extends to deployed models. Beyond system health, it’s possible to log lightweight statistics from incoming data—like average pixel intensity for images—and trigger alerts when those statistics shift sharply. The point is to detect upstream changes (for example, the data pipeline starts producing different-looking images) before they silently degrade predictions. For deeper data monitoring, the transcript highlights distribution drift checks using KL divergence between training-data and prediction-data distributions. A concrete example sets an alert when KL divergence exceeds 0.3, flagging meaningful shifts that may require retraining or pipeline fixes. While major cloud providers offer monitoring for services, distribution-drift alerting may be less visible or not as plug-and-play, which is why some teams “hack up” their own metrics or adopt specialized platforms.
The most important layer is business monitoring—tracking how users actually respond to predictions. Metrics like the number of attempted actions, the fraction of confident predictions that result in an output, and the rate at which users correct those outputs can reveal whether the model is failing in practice, not just in offline tests. In a production example for matching assignment submissions to students, the system tracks daily attempt volume, the percentage of confident matches (e.g., around 73.49% historically), and a correction rate when instructors reject incorrect matches. A sudden drop in confidence rate or a spike in corrections becomes an operational alarm, with thresholds set in conversation with stakeholders (for instance, investigating when corrections exceed about 1%).
Closing the loop—often described as “closing the flywheel”—is where monitoring becomes a continuous-improvement engine. When users correct mistakes, those examples should be routed back into the training dataset so the next training cycle learns from recent failures. The transcript also notes the practical requirement: this only works if the application is instrumented to capture the right signals and provide a fast path for reviewing mistakes. A dashboard-style tool (mode analytics) is mentioned as a custom-built way to inspect recent errors and add them to training data, underscoring that monitoring interfaces often need to be tailored to the specific use case.
A brief Q&A touches on tooling: TensorFlow Extended (TFX) and Google’s AI Platform (now in flux) may offer monitoring and validation capabilities, but feature parity with open-source components and availability of dashboards can vary. The takeaway is to evaluate what’s provided out of the box versus what still requires custom monitoring for model and data drift, plus user-feedback-driven retraining.
Cornell Notes
Monitoring for ML deployments spans three levels: system health, data/model behavior, and business outcomes. Teams track CPU, memory, request volume, latency, and error rates, then add alarms and historical logs to confirm whether changes improve performance. For models, logging input statistics and checking distribution drift (e.g., KL divergence between training and prediction distributions) helps detect upstream shifts; alerts can be set when drift crosses a threshold such as 0.3. The strongest signal comes from user interactions: attempted actions, confident outputs, and correction rates show whether predictions work in real workflows. Capturing those corrections and routing them back into training closes the flywheel for continuous improvement.
What system-level metrics and alarms are most useful for a deployed ML service?
How can teams detect data drift without waiting for model accuracy to collapse?
Why is business monitoring often more decisive than offline metrics?
What does “closing the flywheel” mean in monitoring practice?
What role do dashboards and analytics tools play, and why might teams still build custom ones?
How does the discussion of TFX/AI Platform relate to monitoring?
Review Questions
- Which monitoring alarms would you set for a production ML service to catch both reliability issues and model-related problems?
- How would you design a drift-monitoring metric using training vs prediction distributions, and what thresholding strategy would you use?
- In the assignment-matching example, which metrics indicate that the model is failing in practice, and how would you feed corrections back into training?
Key Points
- 1
Monitor system health for the serving layer using CPU, memory, request volume, latency, and error rate, and set actionable alarms with time windows.
- 2
Log lightweight input statistics from incoming data so abrupt upstream changes trigger alerts before predictions degrade silently.
- 3
Use distribution drift metrics such as KL divergence between training and prediction distributions to detect meaningful shifts; alert when drift crosses a chosen threshold.
- 4
Track business outcomes—attempted actions, confident outputs, and user correction rates—to measure real-world prediction quality.
- 5
Instrument the application to capture user feedback and corrections; without instrumentation, the monitoring loop can’t close.
- 6
Route corrected mistakes back into the training dataset and provide a fast review workflow so retraining incorporates recent failure cases.
- 7
Validate what managed ML platforms provide for monitoring and data validation versus what still requires custom dashboards and metrics.