My 3-Part Workflow to Stand Out In Academia (Keep it simple)
Based on Andy Stapleton's video on YouTube. If you like this content, support the original creators by watching, liking and subscribing to their content.
Run a repeating cycle: Spark for ideas, Map and Frame for turning data into narrative, and Draft and Write for publication-ready text.
Briefing
Academia moves faster—and feels less punishing—when researchers run a repeatable three-part workflow instead of relying on motivation or “working harder.” The core idea is simple: keep ideas flowing, turn data into a coherent research story, and then draft and write in a structured way. Done consistently, the system reduces distractions, prevents work from stalling in limbo, and makes it easier to publish sooner while standing out to supervisors and peers.
The first workflow, “Spark,” is designed to generate and refresh research ideas. It starts with continuous searching for what’s current in a researcher’s main topic, using tools and sources such as Google Scholar, OpenAlex, and Elicit (with optional AI assistance). After gathering references, the workflow insists they be saved immediately into a reference manager like Zotero, Mendeley, or Endnote. The next step is synthesis: first, scan abstracts to spot patterns, then use a tool like NotebookLM to chat with a curated set of sources and extract higher-level themes. This stage is meant to restore direction when creativity dips or the field starts to feel unclear. A practical payoff comes in supervisor meetings—being able to say, “I read a paper recently and it says X, Y, Z,” signals initiative and turns the researcher into a valuable source of fresh insight.
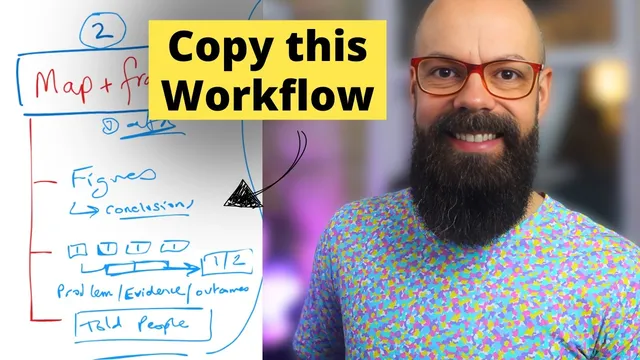
The second workflow, “Map and Frame,” targets the moment data exists but hasn’t become publishable. It begins with creating figures (or schematics) as data is collected, then analyzing that output immediately—ideally the same day or the next day—rather than postponing analysis “for later.” Each figure should support a clear conclusion, and multiple figures must be combined into a single narrative. That narrative should follow a simple structure: the problem being solved, the evidence provided by the figures, and the outcome or broader significance. The emphasis is on keeping the overall message to one or two big reveals so the eventual thesis chapter or paper reads as a unified story rather than a pile of results.
The third workflow, “Draft and Write,” turns research stories into the dense, structured format academics expect. The process starts with bullet points—typically three anchors: problem, evidence, outcome—often organized under each figure. From those bullet points, paragraphs are expanded, then the draft is checked for structure and clarity. A final review stage involves polishing with help from someone else: the reviewer is asked for major edits at the draft stage, while the polish stage focuses on catching obvious errors an editor would dismiss quickly. Across all three workflows, the message is iterative: if ideas stall, return to Spark; if data isn’t becoming narrative, run Map and Frame; if progress toward publication slows, repeat Draft and Write. The system is framed as the difference between staying stuck and finishing a PhD.
Cornell Notes
A three-part workflow helps researchers publish faster by turning scattered effort into a repeatable cycle: Spark, Map and Frame, and Draft and Write. Spark keeps ideas alive through continuous literature searching, saving references in a manager, and synthesizing themes using tools like NotebookLM. Map and Frame converts raw data into publishable narratives by creating figures early, analyzing promptly, and combining figure-level conclusions into a story built around problem, evidence, and outcome. Draft and Write then packages those stories into academic form using bullet points, paragraph expansion, and structured review for clarity and polish. The approach matters because it reduces stagnation, improves supervisor conversations, and prevents work from piling up without results.
How does “Spark” prevent researchers from feeling lost in their own field?
Why does “Map and Frame” insist on analyzing data almost immediately after collecting it?
What structure should a research story follow when combining multiple figures?
How does “Draft and Write” turn research content into academic writing efficiently?
What’s the practical advantage of running these workflows repeatedly rather than once?
Review Questions
- Which specific tools and reference managers are suggested for the Spark workflow, and how do they fit into the sequence?
- In Map and Frame, what are the three elements of a research story, and how should multiple figures contribute to them?
- During Draft and Write, what are the two main checks before polishing, and how should feedback requests differ between draft and final stages?
Key Points
- 1
Run a repeating cycle: Spark for ideas, Map and Frame for turning data into narrative, and Draft and Write for publication-ready text.
- 2
Search continuously for what’s current in the field, using sources like Google Scholar, OpenAlex, and Elicit, and save references immediately in a manager such as Zotero, Mendeley, or Endnote.
- 3
Use synthesis tools like NotebookLM to extract patterns and themes from a curated set of papers, especially when creativity or direction fades.
- 4
Create figures as data is collected and analyze them the same day or next day to avoid letting results pile up without conclusions.
- 5
Combine figure-level conclusions into a single story built around problem, evidence, and outcome, keeping the overall reveal to one or two big messages.
- 6
Draft by starting with bullet points (problem/evidence/outcome), expanding into paragraphs, then checking structure and clarity before a final polish pass with feedback.
- 7
If progress stalls, return to the workflow that matches the bottleneck: ideas (Spark), narrative (Map and Frame), or publishing output (Draft and Write).