Notion at Work: Calculate and Visualize Progress
Based on Notion's video on YouTube. If you like this content, support the original creators by watching, liking and subscribing to their content.
Model progress by linking parent items (Projects or Objectives) to child items (Tasks or Key Results) using a relation property.
Briefing
Progress tracking in Notion can be automated by combining three core building blocks: a centralized database structure, rollups that compute percentages from related items, and formula-based visuals that turn those percentages into at-a-glance progress bars.
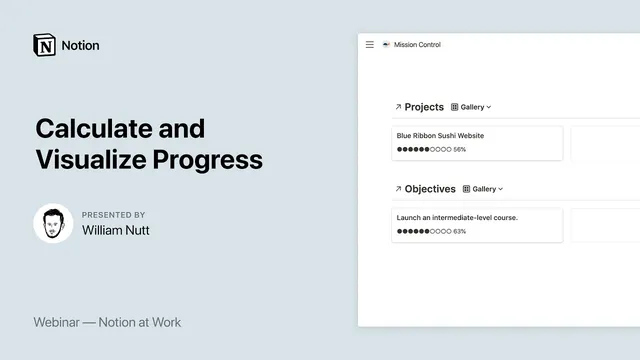
For project management, the workflow starts with a master Projects database and a separate master Tasks database. Each task is linked to exactly one project using a relation property. That setup enables contextual task views—opening a project page can automatically show only the tasks tied to that project. The real payoff comes from a rollup property on the project that calculates overall completion. By rolling up the “complete” checkbox from all related tasks and choosing the rollup option to display the percent checked, each project ends up with a single progress percentage (the example given shows 55.6% completion). The key idea is that once tasks use checkboxes, Notion can aggregate them into a meaningful project-level metric without manual counting.
The same pattern scales to OKRs (Objectives and Key Results), but the progress math changes. An objective is treated as a parent of multiple key results via relations. Unlike tasks, key results track measurable progress using a formula based on a Target value and a Current value. Progress for each key result is calculated as Current ÷ Target, producing a percentage (for example, enrolling 82 students toward a target of 100 yields 82%). Then a rollup on the objective pulls in the progress percentages from all related key results and averages them to produce one overall objective progress figure.
Once progress percentages exist, visualization becomes straightforward. A formula property can convert the numeric percentage into a row of filled and empty characters—using a “slice” approach that references the progress value. The example uses circles to represent filled versus empty states, with a total of 10 circles. With 55.6% progress, the display rounds up to six filled circles and four empty ones. This turns database cards—especially gallery views—into quick visual dashboards. Beyond aesthetics, those progress values also support sorting and filtering, letting projects or objectives with the highest completion rise to the top.
In the Q&A, the discussion clarifies how OKR Target values are chosen: they’re defined by the key result itself because key results are measurable. If a key result is “enrolling 100 students,” the target is 100; if it’s “obtaining 20 favorable online reviews,” the target is 20; and if it’s “discussing the course on three different podcasts,” the target is 3. Current values update as progress is made, and the formula continuously recalculates the percentage. Another question asks about weighting key results differently based on effort; the response notes that the equal-weight approach can be modified by adding a weight property and incorporating it into the progress formula (e.g., multiplying or repeating weighted contributions) so some key results count more than others.
Cornell Notes
Notion progress tracking becomes reliable when projects/goals are modeled with parent-child databases and relations. For projects, tasks use checkboxes and a rollup computes the percent checked across related tasks, yielding a project-level progress percentage (e.g., 55.6%). For OKRs, each key result has Target and Current values, and a formula calculates progress as Current ÷ Target; an objective then rollups and averages the related key result progress values. Those percentages can be visualized with a formula that turns a number into filled/empty characters (like 10 circles) for card-friendly gallery views. The approach supports sorting and filtering by progress, and it can be extended to weighted key results using a weight property.
How does the centralized Projects + Tasks structure enable automatic project progress in Notion?
What changes when moving from project tasks to OKRs?
Where do OKR Target values come from, and how are they used?
How does the progress visualization work without manually editing each card?
How can key results be weighted instead of treated equally?
Review Questions
- In the project-management setup, what two database types and which relation/rollup configuration produce a project-level percent completion?
- For an OKR key result, what is the exact relationship between Target and Current values used to compute progress?
- How does the formula-based progress bar translate a percentage into a fixed number of filled versus empty characters?
Key Points
- 1
Model progress by linking parent items (Projects or Objectives) to child items (Tasks or Key Results) using a relation property.
- 2
Use a rollup on the parent to compute progress automatically from related children—percent checked for task checkboxes, or averaged percentages for OKR key results.
- 3
For OKRs, define measurable Target values directly from the key result text and update Current values as progress happens.
- 4
Calculate key result progress with a formula using Current ÷ Target, then roll up and average those values at the objective level.
- 5
Turn numeric progress into a visual card element using a formula that maps the percentage to a fixed set of filled/empty characters (e.g., 10 circles).
- 6
Sort and filter by the computed progress fields to quickly surface the most advanced projects or objectives.
- 7
To reflect different effort levels, introduce a weight property and incorporate it into the key-result progress rollup logic.