Scientific Figures Without the Design Skills? Illustrae Makes It Possible
Based on Andy Stapleton's video on YouTube. If you like this content, support the original creators by watching, liking and subscribing to their content.
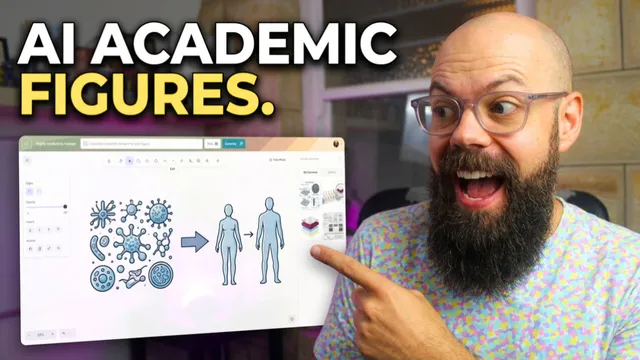
Illustrate generates academic graphical abstracts and posters from pasted research text, using canvases that can hold multiple figures.
Briefing
Academic posters and graphical abstracts have long been a weak spot for AI tools, but Illustrate positions itself as a design-first solution that turns research text into publication-ready layouts. After logging in, users work inside large “canvases” that can hold multiple figures, with options to start from a “brainstorm” flow or create a new canvas from scratch. The interface emphasizes templates, tutorials, and a gallery, while the core workflow centers on pasting research content—titles, author abstracts, and chosen layout preferences—then generating either a graphical abstract or a poster.
In the graphical abstract path, Illustrate takes an abstract and produces a structured visual with editable components. The output shown includes domain-specific elements such as an epoxy transfer method and materials like silver nanowires and carbon nanotubes, plus a “figure of merit” section. Crucially, the generated figure isn’t treated as a single locked image: users can edit parts, replace images (for example, inserting a scanning electron microscope image), and refine the composition. A notable example involves prompting for a “three part” modern circular-flow graphical abstract with text included; the resulting canvas breaks the design into elements that can be rearranged and corrected.
The transcript also highlights a more hands-on approach for building scientific figures from components. Users can generate individual elements—described in the example as a “man eating a burrito”—then edit those elements by sending them into an editable bar (copy/paste into the bar is required rather than drag-and-drop). That same workflow is used to create a roll-to-roll organic photovoltaic device diagram with appropriate layer counts and colors, including a substrate, P.PSS, P3HT/PCBM bulk heterojunction layers, and an aluminium electrode. The tool supports per-element actions like duplicate, delete, crop, and linking, and it offers standard image-manipulation controls such as flipping, layering order (bring forward/send back), and alignment.
Once components are assembled, Illustrate can combine selected elements into a single figure and add callouts—shapes, arrows, and highlighted regions—plus optional frames that keep groups exportable together. Export options include PNG and SVG, with PNG recommended for the generated figure outputs and SVG for scalable components like text and shapes. There’s also an “embed scene” option that preserves scene data for later editing.
Beyond graphical abstracts, Illustrate can generate full posters with layout intelligence. The example poster produced from brainstorm includes convincing scientific styling and even SEM-like details that appear plausible, while the layout itself is presented as a strength compared with other large language model outputs. Users can also generate individual poster components for use elsewhere (such as PowerPoint) by exporting selected elements.
Finally, the transcript notes practical access and pricing: a monthly plan starting at $8.99 AUD and an unlimited option at $24.99 AUD, with the paid tier offering a limited number of image generations per month. Overall, Illustrate is presented as a tool that bridges the gap between scientific content and design execution—turning text prompts into editable, exportable figures and posters without requiring traditional design skills.
Cornell Notes
Illustrate is positioned as an AI design tool for academic graphics, turning pasted research text into graphical abstracts and posters. It works on large canvases that hold multiple editable elements, letting users refine outputs rather than treating them as a single static image. The workflow includes generating a full graphical abstract from an abstract prompt, or building figures from component libraries and custom prompts (including scientific diagrams like an organic photovoltaic layer stack). Users can edit elements, add annotations (arrows, shapes, labels), group items in frames, and export as PNG or SVG for use in papers and slide decks. The appeal is layout competence—especially for posters—plus practical editing and export options.
How does Illustrate turn academic text into a graphical abstract?
What makes the generated figures usable for real revisions instead of being a dead-end image?
How does Illustrate help with scientific accuracy in diagrams like device layer stacks?
What editing and layout tools exist once elements are on the canvas?
How does exporting work for using figures in papers or slide decks?
What’s the advantage of Illustrate for posters compared with other AI outputs?
Review Questions
- When would a user choose “brainstorm” versus starting from scratch with a new canvas in Illustrate?
- What are the key steps to edit a generated element, and what limitation is mentioned about drag-and-drop into the edit bar?
- Why might PNG and SVG exports behave differently for generated figures versus text and shapes?
Key Points
- 1
Illustrate generates academic graphical abstracts and posters from pasted research text, using canvases that can hold multiple figures.
- 2
Outputs are component-based and editable, enabling targeted revisions (including replacing images like SEMs).
- 3
Users can build scientific diagrams from individual generated elements, then combine them into a single figure with annotations and frames.
- 4
Editing requires specific interactions—copy/paste into the edit bar is needed, and there’s no editing history for undoing to a prior state.
- 5
The tool supports standard layout controls such as cropping, layering order (bring forward/send back), flipping, and alignment.
- 6
Export options include PNG and SVG, with PNG emphasized for generated figure outputs and SVG for scalable components like text and shapes.
- 7
Poster creation is highlighted as a layout advantage, producing structured designs that can be reused in slide decks or papers.