Simpson's Paradox
Based on minutephysics's video on YouTube. If you like this content, support the original creators by watching, liking and subscribing to their content.
Simpson’s paradox can produce opposite conclusions when comparing subgroup results versus aggregated totals from the same dataset.
Briefing
Simpson’s paradox can flip the apparent effect of a treatment depending on whether results are grouped by category or combined—so the same dataset can support opposite conclusions. In a medical-style example, treated cats all survive (100%), while untreated cats have a lower survival rate (75%). Treated humans fare worse: only 25% survive, while untreated humans have 0% survival. Taken separately, the treatment looks beneficial for cats and harmful for humans.
But once the data are aggregated across both groups, the story reverses again: only 40% of the combined treated population survives, while 60% of the combined untreated population recovers. The paradox isn’t a mistake in arithmetic; it’s a warning that statistical comparisons can be distorted by how categories are mixed—especially when the categories differ in baseline risk.
The key driver is causality and selection effects. If humans are more seriously ill than cats, and doctors therefore prescribe treatment more often to the sickest humans, then the treated group may start out with a higher likelihood of death even if the treatment improves recovery chances. In that scenario, lower survival among treated humans doesn’t necessarily mean the treatment is bad; it can reflect that the treated humans were more likely to die in the first place.
The same logic can produce the opposite-looking pattern when treatment assignment is biased in the other direction. If humans are more likely to receive treatment than cats for non-medical reasons—such as social or financial incentives—then the raw survival rates by group can mislead. A pattern like “4 out of 5 humans die while only 1 in 5 cats die” might tempt a conclusion that treatment is harmful, even if the treatment actually helps within each group.
Simpson’s paradox also shows up in real-world comparisons such as education. Wisconsin’s overall 8th grade standardized test scores have often been higher than Texas’s, suggesting better teaching. Yet when results are broken down by race, Texas students outperform Wisconsin students across black, Hispanic, and white groups. The overall ranking can still favor Wisconsin because Wisconsin has a different racial composition—proportionally fewer black and Hispanic students and more white students—so the aggregate statistic reflects demographics as much as instruction.
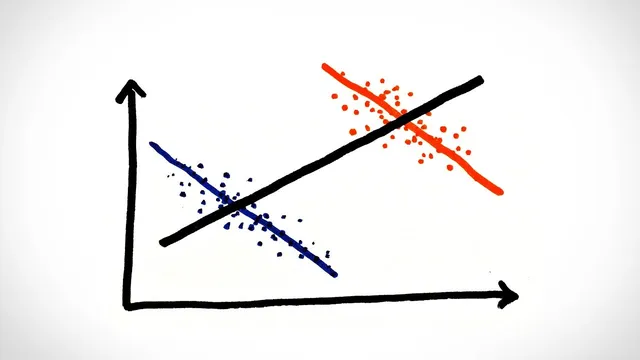
Visually, the paradox can appear when two subgroup trends move in the same direction, but the combined trend moves the opposite way. The transcript even uses a playful “money makes people sadder” versus “money makes cats sadder” setup to illustrate how an overall graph can mislead if the starting populations differ.
The practical takeaway is procedural: controlled experiments must prevent any causally related factors from influencing who receives treatment, while uncontrolled studies must account for outside biases. Statistics alone can’t resolve the paradox; understanding what drives group differences—illness severity, treatment assignment, and demographic composition—is what determines which conclusion is meaningful.
Cornell Notes
Simpson’s paradox shows how the same data can imply opposite conclusions depending on whether results are analyzed within subgroups or after combining them. In the treatment example, cats and humans show different survival rates when separated, but the aggregated survival rates reverse the apparent effect. The reversal happens because group composition can be shaped by causal factors like baseline severity or biased treatment assignment. Without controlling for those influences, aggregate statistics can misrepresent the true effect of a treatment or policy. The lesson extends beyond medicine to comparisons like education, where demographic differences can explain why overall rankings differ from subgroup performance.
How can a treatment look beneficial in subgroup data but harmful after aggregation?
What role does causality play in resolving Simpson’s paradox?
Why can education rankings based on overall test scores be misleading?
What does a “two trends that disagree with the combined trend” graph illustrate?
What should be done in experiments to prevent Simpson’s paradox from distorting conclusions?
Review Questions
- In the cat-and-human treatment example, what specific mechanism allows the aggregated survival rate to reverse the subgroup conclusions?
- Give two different causal stories that could produce Simpson’s paradox in treatment assignment, and explain how each changes the interpretation of survival rates.
- Why can overall standardized test rankings differ from race-by-race performance comparisons?
Key Points
- 1
Simpson’s paradox can produce opposite conclusions when comparing subgroup results versus aggregated totals from the same dataset.
- 2
Baseline differences and selection effects—such as illness severity—can make treated and untreated groups incomparable.
- 3
Understanding treatment assignment requires causal reasoning; statistics alone can’t determine which conclusion is correct.
- 4
Uncontrolled studies must account for outside biases that influence who receives treatment or benefits from a program.
- 5
Overall education rankings can be driven by demographic composition even when subgroup performance tells a different story.
- 6
Graphical summaries can mislead when subgroup trends combine into an overall trend that points the opposite direction.
- 7
Controlled experiments should prevent causally related factors from affecting treatment assignment.