Systematic Literature Review using Dimensions Ai || Bibliometric Analysis and Visualization || Hindi
Based on eSupport for Research's video on YouTube. If you like this content, support the original creators by watching, liking and subscribing to their content.
Dimension AI supports keyword-driven identification of literature, then narrowing via time range, publication type, SDG/topic alignment, and classification filters to reach an analyzable dataset size.
Briefing
Dimension AI is positioned as a research database platform for running bibliometric analysis and systematic literature reviews (SLRs) by turning keyword searches into filtered, exportable datasets that can then be analyzed through built-in analytics and downstream visualization tools. The core workflow starts with searching for a research theme—such as “ECG signal analysis”—and then narrowing results using time windows, publication types, and other filters to reach a manageable set of records suitable for screening and meta-level synthesis.
After logging in and landing on the profile area, the process emphasizes search-driven identification of relevant literature. A keyword query can initially return very large result counts (the transcript cites figures in the hundreds of thousands to millions), but the platform supports tightening the scope by selecting a recent time range (e.g., last five years), applying topic/SDG-related constraints (the example filters toward “Good health and well-being”), and limiting by publication type (e.g., articles only). Additional narrowing can target specific classification groupings (the transcript references a “UGC CARE Group 2” filter) and exclude certain record categories (such as “open access” considerations), ultimately producing a final dataset size that is practical for analysis—around 11,000 documents in one filtered scenario and about 1,300 documents in the main export example.
With the filtered set ready, the platform’s export function becomes the bridge to bibliometric and SLR-style workflows. Export is capped at a maximum number of records per download (the transcript mentions a limit of 2,500), and exported files can be saved for later use in visualization and analysis environments. The transcript then demonstrates staying within Dimension AI’s analytics view: selecting an “analytical view” for the exported dataset and generating charts and summaries.
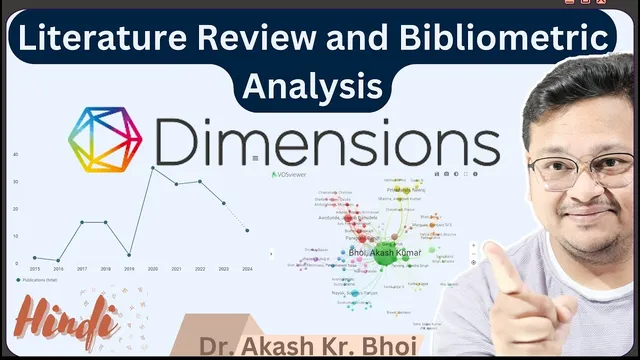
Key analytics shown include research category aggregation (presented as bar charts), publication overview metrics (total publications within the chosen time window, with counts and site-based indicators), and downloadable outputs such as PNG images and data files (CSV/PDF are also mentioned). The platform also supports author-level exploration through an “researcher” view, where contributors tied to the dataset can be listed and examined.
Beyond descriptive statistics, the transcript highlights network-style analysis. An author network view reveals how researchers are connected within the selected literature set, and the same dataset can be re-filtered by institution or author. For instance, typing an institution name (e.g., “Sikkim Manipal University”) is described as enabling direct navigation to the relevant analytical results, while author-specific filtering can isolate output associated with a particular researcher affiliation (the transcript cites an example tied to “AMU”).
Overall, Dimension AI is presented as a systematic, filter-first pipeline: search → screen-like filtering → exportable dataset → analytical dashboards and network views. The transcript also signals that deeper bibliometric techniques—such as visualization tools and additional analyses—can be handled in subsequent steps or companion videos, with PRISMA 2020 referenced as a framework for structuring identification, screening, selection, and final analysis stages in SLRs.
Cornell Notes
Dimension AI can be used to build an SLR-ready bibliometric dataset by starting with a keyword search (e.g., “ECG signal analysis”) and then applying filters such as last-N-years, publication type (articles only), SDG alignment (e.g., “Good health and well-being”), and classification constraints (e.g., UGC CARE Group 2). After narrowing to a workable number of records (the example uses ~1,300), the results can be exported (with a per-export cap of 2,500) and analyzed inside Dimension AI’s analytical views. The platform provides category-level aggregation, publication overview metrics, downloadable chart/data outputs, and researcher/institution views. Author network analysis helps show how contributors connect within the selected literature set.
How does the workflow in Dimension AI move from a broad keyword search to an SLR-style dataset?
What kinds of filters are demonstrated, and what effect do they have on the dataset size?
What does exporting accomplish, and what limits are mentioned?
What analytical outputs are shown inside Dimension AI after exporting?
How is network analysis used, and how can it be customized?
Review Questions
- If a keyword search returns hundreds of thousands of records, which specific filter sequence (time window, SDG/topic, publication type, classification) would most directly reduce it to an SLR-manageable dataset?
- What is the purpose of exporting records from Dimension AI, and what per-export record limit is mentioned?
- How do author network and researcher/institution views complement category and publication-overview charts in bibliometric analysis?
Key Points
- 1
Dimension AI supports keyword-driven identification of literature, then narrowing via time range, publication type, SDG/topic alignment, and classification filters to reach an analyzable dataset size.
- 2
A practical SLR pipeline in the transcript follows: search → filter/screen-like reduction → select final records → export for bibliometric analysis.
- 3
Exported datasets can be downloaded for further work, with a stated maximum of 2,500 records per export.
- 4
Dimension AI’s analytical view provides category-level aggregation (bar charts), publication overview metrics (counts across the selected period), and downloadable outputs (PNG/CSV/PDF).
- 5
Researcher and author network views reveal contributor-level patterns and collaboration structures within the selected literature set.
- 6
Institution and author-specific filtering (via search) enables targeted bibliometric analysis and changes the resulting network and publication summaries.