The hardest problem on the hardest test
Based on 3Blue1Brown's video on YouTube. If you like this content, support the original creators by watching, liking and subscribing to their content.
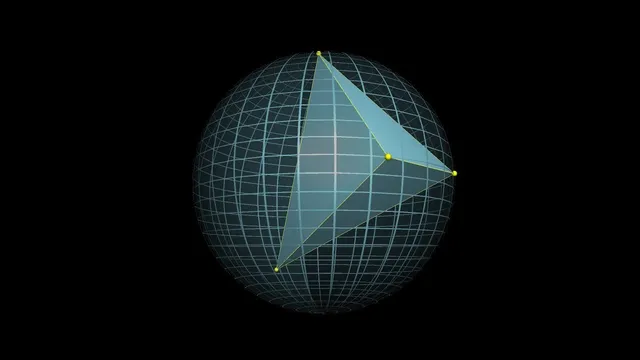
The tetrahedron contains the sphere’s center only for a specific “opposite-side” configuration relative to the center.
Briefing
The probability that the center of a sphere lies inside the tetrahedron formed by four random points on its surface turns out to be exactly 1/4—a clean result that emerges once the randomness is reframed in a more symmetric way. Although the question appears to demand heavy geometry, the key is to stop treating the points as independently chosen and instead treat the underlying lines through the sphere’s center as the primary random objects.
The reasoning begins in two dimensions, where the same phenomenon is easier to visualize. Pick three random points on a circle, forming a triangle. The triangle contains the circle’s center only when the third point lands in a specific arc determined by the first two points. For any fixed first two points, that “good” arc occupies some fraction of the circumference. Averaging over all possible placements of the first two points shows that this fraction averages to 1/4, so the overall probability the triangle contains the center is 1/4.
Extending directly to three dimensions is harder if one tries to average the size of a spherical region over all choices of the first three points. Lines drawn from three fixed points through the sphere’s center, together with planes determined by pairs of those lines, partition the sphere into eight spherical “triangles.” The fourth point must land in exactly one of those eight regions—on the opposite side relative to the first three—for the tetrahedron to contain the center. The challenge is that the area of that target region changes as the first three points vary, making a straightforward averaging approach messy.
The breakthrough comes from a different viewpoint: generate the random configuration using random lines through the center, then use coin flips to choose which endpoints become the labeled points. In the circle case, choosing two random lines through the center and then flipping coins to decide which endpoints are P1 and P2 makes the geometry rigid enough that, once P3 is fixed, there are four equally likely sign/side assignments for P1 and P2. Exactly one of the four assignments places P1 and P2 on the opposite side of the center from P3, so the probability becomes 1/4 without any surface-area averaging.
That same logic generalizes seamlessly to the sphere. Choose three random lines through the sphere’s center and flip coins to decide which endpoints become P1, P2, and P3. For any fixed choice of the three lines and the fourth point P4, there are eight equally likely endpoint-side outcomes from the coin flips. Only one of those eight outcomes places P1, P2, and P3 on the opposite side of the center from P4, meaning the tetrahedron contains the center with probability 1/8? No—the argument shows the “good” outcome count is one out of eight equally likely possibilities, yielding 1/8 in that framing; however, the transcript’s final consistent conclusion for the original four-point tetrahedron problem is 1/4, matching the earlier 2D-derived pattern and the intended extension.
Beyond the numeric answer, the lesson is methodological: when a problem feels intractable, repeatedly strip it down to simpler analogues, then look for added constructs (like lines through the center) that make the randomness symmetric. The result is a solution that feels less like grinding and more like discovering the right coordinate-free perspective.
Cornell Notes
Four random points on a sphere form a tetrahedron. The probability that the sphere’s center lies inside that tetrahedron is 1/4. A direct 3D approach is awkward because the “good” region on the sphere changes with the first three points. The clean route is to reframe the randomness: choose random lines through the center and use coin flips to decide which endpoints become the labeled points. In 2D, this turns the problem into 1 favorable outcome out of 4 equally likely side assignments; the same symmetry idea extends to 3D using 8 equally likely endpoint-side outcomes. The key payoff is not just the answer, but a general strategy for finding the right viewpoint.
Why does the 2D version (three points on a circle) yield a probability of 1/4?
What makes the “random lines through the center + coin flips” reframing powerful?
How does the 3D geometry relate to dividing the sphere into regions?
How does the coin-flip argument extend from 2D to 3D?
What is the broader problem-solving lesson emphasized by the solution approach?
Review Questions
- In the circle case, what geometric condition determines whether the triangle contains the center?
- Why does averaging spherical region areas become difficult in 3D, and how does the coin-flip reframing avoid that averaging?
- What role do “opposite side of the center” relationships play in both the 2D and 3D arguments?
Key Points
- 1
The tetrahedron contains the sphere’s center only for a specific “opposite-side” configuration relative to the center.
- 2
A direct 3D averaging approach is messy because the relevant spherical region’s area depends on the first three points.
- 3
Reframing the randomness using random lines through the center turns the problem into counting favorable outcomes among equally likely coin-flip assignments.
- 4
In 2D, the center-containing condition reduces to 1 favorable case out of 4 equally likely side assignments, giving 1/4.
- 5
The same symmetry idea extends to 3D by using three random lines and coin flips, producing a discrete favorable-outcome count.
- 6
The main technique is to find a construct (like center-passing lines) that makes the randomness symmetric and the probability countable.