The Odd Number Rule
Based on Vsauce's video on YouTube. If you like this content, support the original creators by watching, liking and subscribing to their content.
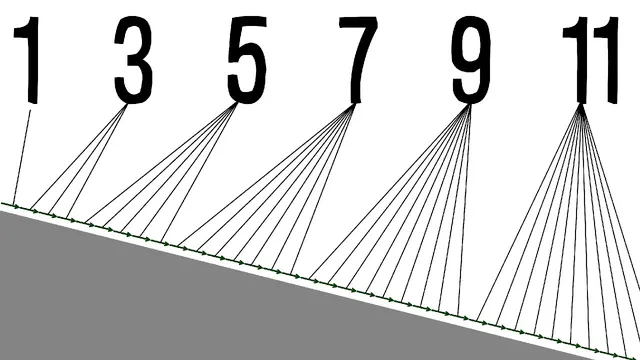
Odd numbers (1, 3, 5, 7, …) arise from the area under a straight-line velocity–time graph when acceleration is constant.
Briefing
The core finding is that the “odd number rule” isn’t a mystical coincidence—it falls out of how distance accumulates when velocity increases at a constant rate. When an object speeds up uniformly under gravity, the distance it travels during successive one-second intervals follows a sequence of odd numbers (1, 3, 5, 7, 9, …). That pattern matters because it turns a messy physical question—how far something falls—into a clean mathematical relationship: constant acceleration produces a straight-line velocity graph, and the distance traveled in each time slice equals the area under that graph. The odd numbers emerge from the geometry of those areas.
The transcript starts by challenging the idea that “rules” are always explicit. A dog playing middle school basketball seems like it should be allowed because no rule explicitly bans it. But the legal/eligibility framework still blocks it: Airbud’s case hinges on participation requirements (being a “regular member” of the school, enrolled half-time or more) and on the fact that no approved exceptions apply. That setup primes the audience for a similar lesson in physics and math: the most important constraints often aren’t written as obvious “bans,” but they show up in the underlying structure.
From there, the discussion pivots to gravity. If an object starts from rest and accelerates, its velocity grows linearly with time. The key move is to slice time into equal intervals and look at the corresponding areas under the velocity-time graph. In the first interval, the area is treated as one unit of distance. In the second interval, the triangle’s area can be decomposed into a rectangle plus a triangle, and the constant slope ensures the added pieces match the original area in a way that doubles the count. Repeating the decomposition across intervals yields a cumulative pattern: each new time slice adds one more “unit area” than the previous slice, producing the odd-number sequence. The transcript summarizes this as the mathematical form of odd numbers, 2n + 1.
The explanation also connects this area-under-a-curve idea to acceleration more generally. If velocity changes continuously, distance isn’t captured by a single rectangle; it requires summing many small rectangles. As measurements become more frequent, the sum converges to the exact area under the velocity curve—reinforcing why the constant-acceleration case produces a precise, repeatable pattern.
Finally, the transcript broadens the theme of “rules hiding in plain sight” with two additional examples. One is a historical coincidence: the assassination of Archduke Franz Ferdinand on June 28, 1914, with a license plate reading “II 18,” followed by the chain of events leading to World War I and ending on Armistice Day, November 11, 1918—framed as “odd” numerical echoes. The other is a geography/geometry story about Colorado: it was originally defined as a “geospherical rectangle” by lines of latitude and longitude, but surveying errors and later legal rulings left it with a boundary that doesn’t match a true rectangle, including a misfit number of sides. Together, these segments reinforce the same message: patterns and constraints often live in the math beneath the surface—whether in falling objects or in the shapes and rules people rely on.
Cornell Notes
Uniform acceleration turns distance into a geometry problem. With gravity, velocity increases at a constant rate, so a velocity–time graph becomes a straight line. When time is split into equal intervals, the distance traveled in each interval equals the area of the corresponding slice under the graph. Those slice areas grow as 1, 3, 5, 7, … because each new interval adds one more unit of the original triangle area, matching the odd-number form 2n + 1. The result matters because it explains a physical pattern (falling distances) using the same “area under a curve” principle that also underpins how changing velocity accumulates into total displacement.
Why do odd numbers appear in the distances traveled during successive seconds of a falling object?
How does the “area under the velocity curve” idea handle changing velocity?
What role does constant acceleration play in making the pattern so clean?
How does the transcript’s “rule” example (Airbud) connect to the physics lesson?
Why is the Colorado boundary story used as another “hidden structure” example?
Review Questions
- In a constant-acceleration scenario, what mathematical object (graph feature) determines the distance traveled over a time interval?
- How does increasing the frequency of velocity measurements change the accuracy of distance estimates in the transcript’s rectangle-summing argument?
- What specific property of the velocity–time graph guarantees that the distances in successive equal intervals follow the odd-number sequence?
Key Points
- 1
Odd numbers (1, 3, 5, 7, …) arise from the area under a straight-line velocity–time graph when acceleration is constant.
- 2
Distance traveled during each equal time interval equals the area of the corresponding slice under the velocity curve.
- 3
For constant acceleration, the velocity–time graph is linear, making the geometric decomposition repeatable and producing the 2n + 1 pattern.
- 4
When velocity changes continuously, using many small rectangles (more frequent measurements) makes the summed area converge to the true displacement.
- 5
The Airbud eligibility example illustrates that “no explicit ban” can still be overridden by underlying rule requirements and missing exceptions.
- 6
Colorado’s “geospherical rectangle” ideal shows how intended geometric definitions can be altered by surveying error and legal rulings, producing a boundary with far more than four sides.