The Physics Of Dissonance
Based on minutephysics's video on YouTube. If you like this content, support the original creators by watching, liking and subscribing to their content.
Consonance and dissonance can be modeled by combining physical beating/roughness effects with the ear’s limited ability to resolve nearby frequencies.
Briefing
The most dissonant three-note chord in Western music theory isn’t “mysteriously wrong”—it’s the result of how the ear and the physics of sound interact when overtones line up badly. A quantitative dissonance map (a 3D chart of all possible triads) shows deep valleys where chords sound stable and “in tune,” and sharp peaks where chords sound tense. The striking part: many of the valley-bottom chords line up with familiar Western fundamentals—major, minor, inversions, and suspended chords—while nearby peak chords can sound equally “fundamental” until small tuning tweaks push the overtones into a more dissonant alignment.
That sensitivity to tiny changes matters because it ties musical consonance to measurable physical effects rather than purely cultural preference. Sound begins as pressure waves and becomes a pattern of vibrations that the ear’s mechanics and neural processing translate into pitch and roughness. When two pure sine waves sit close in frequency but not exactly together, they produce beating—an alternating pattern of constructive and destructive interference that the ear can’t resolve cleanly. As the frequencies get closer, the beating slows into a noticeable “wo-wo” modulation; as they get even closer, the ear’s limited frequency resolution smears the two tones into a single rough, uncomfortable sound. Controlled experiments support a “zone of discomfort” around near-matching frequencies, with dissonance dropping to near zero only when the frequencies match.
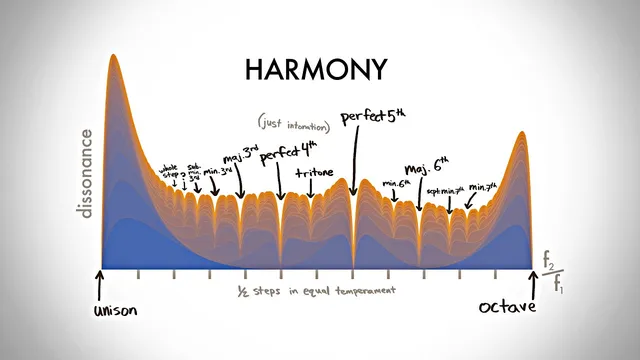
But real instruments don’t produce single sine waves. Notes come with overtones, and harmony emerges from the combined dissonance between every overtone of one note and every overtone of the other. For instruments like strings and pipes, the overtone series follows simple integer ratios (1×, 2×, 3×, …). Those ratios create specific frequency alignments where many overtone pairs avoid the dissonant “roughness” region at once—forming the valleys in the dissonance landscape. The same framework explains why familiar intervals (octave, fifth, fourth, major/minor thirds, sixths) tend to land near consonant minima: they’re the intervals that most consistently line up the harmonic overtones.
The story also explains why tuning systems and instruments shift what counts as “in tune.” Equal temperament approximates the most consonant ratios but can push some intervals—like the major third—toward a dissonance peak. When instruments have overtone structures that differ from ideal strings and pipes, the consonant intervals shift too. Piano string stiffness and stretching, for example, forces higher notes sharp and lower notes flat to keep internal overtone relationships aligned. More broadly, non-Western instruments such as Indonesian gamelan and Thai classical ensembles use bars, gongs, and kettles whose overtones don’t match the harmonic series; their dissonance minima align with different scales.
Finally, the 3D chord map emerges from summing overtone-to-overtone dissonances across three notes. The most universally dissonant region corresponds to chords whose components behave like badly mismatched sine-wave pairs, while the most musically “interesting” peaks and valleys farther from the origin reflect overtone-driven harmony. The analysis has limits—whole and half steps don’t appear as cleanly “in tune” intervals, and harmony depends on more than dissonance alone—but it offers a physics-first explanation for why consonance feels stable and tension feels avoidable: overtones, not just fundamentals, do the heavy lifting.
Cornell Notes
Consonance and dissonance can be modeled quantitatively by tracking how the ear responds to frequency differences and how overtones interact. Two nearly equal sine waves create beating and “roughness” because the ear can’t fully resolve them, producing a zone of discomfort around close-but-not-equal frequencies. Real notes include many overtones, so harmony arises when many overtone pairs avoid that discomfort region simultaneously—creating valleys in a dissonance graph. For strings and pipes, the harmonic overtone series (integer multiples) naturally produces consonant intervals and triads found in Western music, while different instruments (bells, drums, bars) shift the overtone pattern and therefore shift which intervals and chords sound stable. The chord dissonance map is built by summing overtone-to-overtone dissonances across three notes, yielding peaks for tense triads and valleys for familiar chord families.
Why do two pure sine waves close in frequency sound “rough” or uncomfortable instead of just like two pitches?
How do overtones change the consonance story compared with sine waves?
Why do Western “fundamental” intervals (octave, fifth, major/minor thirds) tend to land in consonant valleys?
How can a chord that “should” be consonant become dissonant with only a slight tuning change?
Why do different instruments and cultures often prefer different scales?
What does the 3D dissonance graph for triads represent?
Review Questions
- How do beating and the ear’s limited frequency resolution combine to produce a “zone of discomfort” for close-but-not-equal sine-wave frequencies?
- In what way does summing overtone-to-overtone dissonances explain why intervals like the octave and fifth tend to be consonant for strings and pipes?
- Why might equal temperament make some intervals (e.g., the major third) land closer to a dissonance peak than just intonation would?
Key Points
- 1
Consonance and dissonance can be modeled by combining physical beating/roughness effects with the ear’s limited ability to resolve nearby frequencies.
- 2
Two identical pure tones are maximally stable, while close-but-not-equal tones create beating and roughness that produces a measurable discomfort zone.
- 3
Real harmony depends on overtones: dissonance between notes is the sum of dissonances across all overtone pairs, weighted by overtone loudness.
- 4
For instruments with harmonic-series overtones (strings and pipes), many familiar Western intervals land near dissonance minima because their ratios align overtone frequencies.
- 5
Small detuning shifts overtone alignments, moving chords from valley bottoms (stable) to peak tops (tense).
- 6
Different overtone spectra across instruments (piano stiffness, bells, drums, bars) shift which intervals and scales sound most stable, helping explain cross-cultural differences.
- 7
The chord dissonance map is computed by summing overtone-to-overtone dissonances across three notes, producing peaks for tense triads and valleys for common chord families.