Tutorial: creating the sound of hydrogen
Based on minutephysics's video on YouTube. If you like this content, support the original creators by watching, liking and subscribing to their content.
Use Mathematica’s play to synthesize audio by summing sine waves over time (e.g., t from 0 to 3 seconds).
Briefing
Creating the sound of hydrogen comes down to turning hydrogen’s emission spectrum into a set of audio frequencies and amplitudes. Instead of stacking harmonics like a “violin,” the method uses the Rydberg formula to generate the spectral line frequencies for specific hydrogen series (Lyman and Balmer), then synthesizes a waveform by summing sine waves at those frequencies. The result is a “pipe-like” squiggly tone that resembles the iconic hydrogen sound, and it gets closer to the original when multiple series are combined or when real measured spectral data is used.
The tutorial starts with basic sound synthesis in Mathematica using the play command, demonstrating that a single sine wave (e.g., 440 Hz) produces a simple beep, while changing frequency (880 Hz) shifts pitch an octave higher. It then shows how more complex, less boring tones can be built by summing sine waves. A first attempt mimics an instrument string by using the harmonic series: summing sinusoids whose frequencies are scaled by n (from 1 to 10). That produces a harsh buzz because real strings have weaker higher harmonics, so the amplitude of each partial is modulated by 1/n. Adjusting the sample rate upward (from Mathematica’s default 8000 Hz to 16,000–32,000 Hz) improves fidelity.
For hydrogen, the harmonic-series trick is replaced with atomic physics. The spectral lines follow the Rydberg formula, expressed as (1/n1^2) − (1/n2^2), which determines where emission frequencies appear. For the Lyman series, the tutorial constructs a sum of sine waves using the Lyman transition structure, starting at n = 2 (since the Lyman series begins there) and summing up to n = 10 for practicality. The waveform is time-sampled over 0 to 3 seconds and scaled to an audible base frequency (using 440 as a reference multiplier), producing a squiggly sound that already resembles the hydrogen tone.
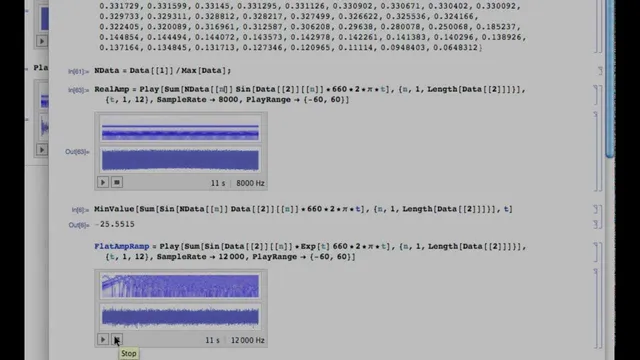
To add more low-end content, the tutorial then incorporates the Balmer series. Using the Balmer transition (with the fixed 1/2^2 term, i.e., 1/4) and shifting the summation index so it starts at n = 3, the synthesized audio becomes deeper and closer to the original hydrogen sound. The closest match comes from abandoning purely theoretical line positions and instead using experimental measurements: the tutorial pulls hydrogen’s spectrum from the NIST Atomic Spectra Database, including the relative brightness (amplitudes) of each spectral line. After normalizing the downloaded data and mapping it into Mathematica’s synthesis pipeline, the resulting audio aligns closely with the “sound of hydrogen” from the earlier video.
Overall, the core insight is that hydrogen’s audio character isn’t a special trick—it’s a direct sonification of spectral lines, where both frequency spacing (from the Rydberg formula or measured data) and line strength (amplitude) shape the final timbre.
Cornell Notes
The “sound of hydrogen” can be synthesized by converting hydrogen’s spectral lines into audio frequencies and summing sine waves. A basic approach uses the Rydberg formula to generate the Lyman series (starting at n = 2) and synthesizes a waveform over a few seconds, producing a squiggly tone. Adding the Balmer series (starting at n = 3 with the 1/4 term) increases the low-frequency content and makes the result closer to the original. The best match comes from using real measured spectral data from the NIST Atomic Spectra Database, including the relative amplitudes of spectral lines, then normalizing and feeding those values into the synthesis.
How does the tutorial build sound from simple math before using hydrogen-specific physics?
Why does the harmonic-series method sound like a “crappy violin,” and what fixes it?
What replaces the harmonic series when synthesizing hydrogen’s sound?
How are the Lyman and Balmer series handled differently in the synthesis?
Why does using NIST experimental data improve the match to the original hydrogen sound?
Review Questions
- If you were to synthesize hydrogen using only the Lyman series, what change would you make to add more bass content?
- What role does amplitude weighting (like 1/n for harmonics) play in shaping timbre, and how is an analogous idea handled for hydrogen using spectral line brightness?
- Why does summing to a finite n (e.g., up to 10) matter for computation, and what would happen if the sum were extended much further?
Key Points
- 1
Use Mathematica’s play to synthesize audio by summing sine waves over time (e.g., t from 0 to 3 seconds).
- 2
A harmonic-series approach can mimic string-like sounds, but it needs amplitude roll-off (e.g., weighting by 1/n) to avoid a harsh buzz.
- 3
Hydrogen’s tone comes from sonifying atomic spectral lines, not musical harmonics, using the Rydberg formula (1/n1^2) − (1/n2^2).
- 4
Generate the Lyman series by summing from n = 2 upward; generate the Balmer series using the 1/4 term and starting at n = 3 for the chosen indexing.
- 5
The closest match uses the NIST Atomic Spectra Database’s measured hydrogen spectrum, including relative line amplitudes, then normalizes and maps that data into the synthesis.
- 6
Increase sample rate (e.g., 16,000–32,000 Hz instead of 8000 Hz) to improve audio fidelity when rendering the waveform.