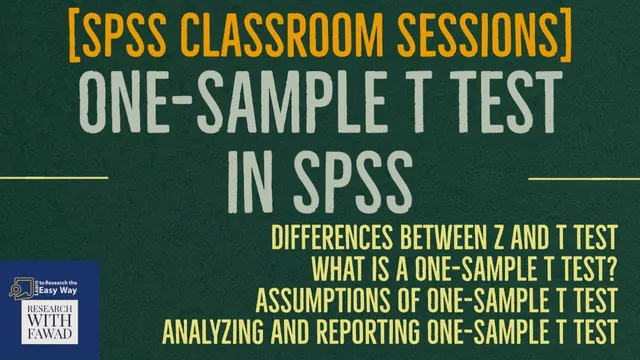
07. SPSS Classroom - Analyzing and Reporting One Sample T Test in SPSS
Based on Research With Fawad's video on YouTube. If you like this content, support the original creators by watching, liking and subscribing to their content.
A one-sample t test compares a single sample mean to a specified benchmark (test value) and is used when population standard deviation isn’t known exactly.
Briefing
A one-sample t test is the go-to method when researchers have a single sample and want to check whether its mean matches a known population benchmark—like a company’s advertised product lifetime or a school’s claimed graduate salary. It matters because it turns a claim about “average equals X” into a statistical decision using a t statistic and a p-value, letting analysts quantify whether observed differences are likely due to chance.
The session frames the one-sample t test as the sample-based counterpart to the z test. Both rely on the same general logic—comparing a sample mean to a standard value—but they differ in assumptions. Z tests typically require known population parameters (mean and standard deviation), while t tests are used when those population values aren’t known exactly. In real-world settings, analysts often only have a benchmark value (for example, a claimed mean) and must estimate variability from the sample, making the t test more practical. Sample size guidance is also given: results from t tests tend to align closely with z tests when sample sizes are around 30–40, so the method doesn’t demand huge datasets.
Three t-test variants are introduced to clarify when each applies: one-sample t test (one sample vs. a population mean), independent-samples t test (two independent groups), and dependent (paired) t test (the same subjects measured twice). The focus then narrows to the one-sample t test, used for questions like whether regional per capita income equals a national average, whether a product’s household penetration meets a target level, or whether manufacturing dimensions have drifted from original specifications.
Validity hinges on assumptions. Independence of observations is treated as the most critical: if observations are linked (for instance, if one person’s outcome influences another’s), p-values can become misleadingly small, increasing the risk of false “significant” findings. The variable should be measured on an interval or ratio (numerical) scale. Normality is also required for fully reliable inference, but the session emphasizes that the t test is fairly robust to mild departures—especially with moderate or large samples.
An SPSS walkthrough grounds these ideas in a concrete example. A business school claims its graduates earn an average of 750,000 rupees per year. A sample of 30 graduates is collected, and the null hypothesis is set as “the population mean equals 750,000.” Before running the test, SPSS is used to check normality via skewness and kurtosis from descriptive statistics; the reported skewness is -0.263 and kurtosis is -0.744, both within commonly cited acceptable ranges. Then SPSS runs the one-sample test under “Analyze → Compare Means → One-Sample T Test,” using 750,000 as the test value.
The output shows a sample mean of 691.584 (with n=30) and a two-tailed p-value reported as 0 (with t = -6.184 and df = 29). With a 5% significance level, p < 0.05 leads to rejection of the null hypothesis. The conclusion is straightforward: the graduates’ average salary is significantly different from the advertised 750,000, and because the sample mean is lower, the claim does not hold.
Cornell Notes
A one-sample t test checks whether the mean of a single sample equals a known benchmark (the population mean value used as the “test value”). It’s preferred over a z test when population standard deviation (and sometimes the population mean) isn’t known, because the t test estimates variability from the sample. Key assumptions include independence of observations, a numerical (interval/ratio) measurement scale, and approximate normality (with the t test being robust to mild non-normality, especially around moderate sample sizes). In the SPSS example, 30 graduates are tested against a claimed mean salary of 750,000 rupees. Skewness (-0.263) and kurtosis (-0.744) support normality, and the one-sample t test yields p < 0.05, so the claim is rejected because the sample mean (691.584) is significantly lower than 750,000.
When should analysts use a one-sample t test instead of a z test?
Why is independence of observations treated as the most important assumption?
How does normality get checked in the SPSS workflow described?
How are hypotheses set up for the business school salary claim?
How should the t test result be interpreted beyond just the p-value?
Review Questions
- In what situations would a dependent (paired) t test be more appropriate than a one-sample t test?
- What specific failure mode occurs when the independence assumption is violated in a one-sample t test?
- In the SPSS example, which normality statistics were used, and what decision followed from their values?
Key Points
- 1
A one-sample t test compares a single sample mean to a specified benchmark (test value) and is used when population standard deviation isn’t known exactly.
- 2
Z tests and t tests share the same comparison logic, but they rely on different assumptions about known population parameters.
- 3
Three t-test types exist—one-sample, independent-samples, and dependent (paired)—and the correct choice depends on study design.
- 4
Independence of observations is the most critical assumption; violating it can make p-values artificially small and inflate false positives.
- 5
The measurement variable should be numerical on an interval or ratio scale.
- 6
Normality can be checked in SPSS using skewness and kurtosis; the t test is robust to mild departures, especially with moderate sample sizes.
- 7
In the salary example, SPSS produced p < 0.05 and a sample mean below the test value, leading to rejection of the business school’s 750,000 rupee claim.