Advanced OKR and KPI tracking in Notion
Based on Martin Adams's video on YouTube. If you like this content, support the original creators by watching, liking and subscribing to their content.
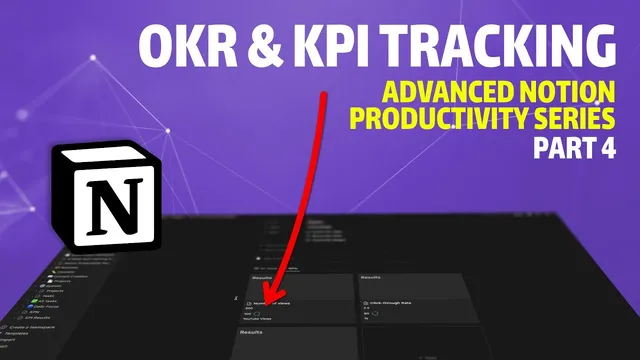
Tag every project with a quarter-based OKR select property so views can group initiatives by time window.
Briefing
A Notion-based OKR system can turn project planning into measurable outcomes by linking goals (OKRs) to KPIs and then tracking KPI results over time—complete with an automatically calculated “current value” and capped progress percentage. The payoff is practical: teams can see whether work is actually moving key metrics, not just whether tasks are being completed.
The workflow starts by adding an “OKR” property to every project using a select field that maps initiatives to time windows (e.g., “2023 Q1,” “2023 Q2,” etc.). Once projects carry an OKR quarter label, custom views can filter and display what’s “in progress” for each quarter, making it clear what the organization is prioritizing across the year. For example, content creation projects can be assigned to a specific quarter initiative, while other projects like a book-writing effort can be placed into a different quarter. This creates a simple but powerful way to group work by when it’s meant to land.
Next comes KPI tracking. Each project gets a set of KPIs—metrics like YouTube views, click-through rate, or monetized revenue for a video project, and waitlist signups or purchases for a book project. To keep the system flexible, KPIs live in a dedicated database. Each KPI record relates back to a single project and stores three core fields: a KPI name, a starting value (“from”), and a target value (“to”), with units (e.g., views, %, pounds) used to clarify what the numbers mean. Projects then display their KPIs via a linked view (and can be arranged as boards or other layouts).
The system becomes truly “OKR-like” when it adds KPI results over time. A second database records performance snapshots: each entry includes a date, a numeric value, and a relation back to the KPI being measured. KPI records then roll up those historical results to compute a “current value.” Because rollups can return multiple values, the setup uses a formula trick to extract the latest entry (the last value in the comma-separated list) so the project always shows the most recent performance.
Finally, a progress formula converts the current value into a percentage between the starting and target values. The calculation subtracts the starting value from the current value, divides by the target range (target minus start), multiplies by 100, and then caps the result so it stays between 0% and 100% even if performance dips or overshoots. That capped progress is what powers clean visualizations and makes the system honest.
At the project level, KPIs appear as “cards” (e.g., in a gallery view) showing current value, start, target, and progress. When progress stalls—say click-through rate isn’t improving—the workflow ties the measurement back to action: identify the tasks needed to move the KPI (like changing a video title or thumbnail), then plan those tasks into the existing task system. The result is a feedback loop where iteration is driven by metrics, not guesswork.
Cornell Notes
The system builds an OKR-to-KPI pipeline in Notion: projects are tagged with a quarter-based OKR property, each project holds multiple KPI definitions (name, start, target, units), and a separate KPI results database logs dated performance snapshots. Rollups then compute a “current value” by extracting the latest KPI result, and a formula converts current performance into a capped 0–100% progress metric based on the start-to-target range. This matters because it turns project tracking into outcome tracking—teams can see whether work is moving key metrics and adjust tasks when progress stalls. The approach is especially useful for content and revenue goals where performance changes day to day.
How does the workflow use an “OKR” property to organize projects across time?
What fields make a KPI definition usable for progress tracking?
Why is a separate “KPI results” database necessary?
How does the system determine the “current value” from multiple KPI results?
How is KPI progress calculated and why is it capped?
How does the KPI dashboard connect measurement to action?
Review Questions
- What is the difference between a KPI definition and a KPI result in this setup?
- Describe how the “current value” is derived when multiple KPI results exist for the same KPI.
- Why does the progress formula cap values between 0% and 100%, and what problem would uncapped values cause?
Key Points
- 1
Tag every project with a quarter-based OKR select property so views can group initiatives by time window.
- 2
Store KPI goals in a dedicated KPI database with numeric starting and target values plus units for clarity.
- 3
Log dated KPI performance in a separate KPI results database linked to each KPI definition.
- 4
Use rollups plus a formula trick to extract the latest KPI result as the “current value.”
- 5
Calculate progress as a percentage of the start-to-target range, then cap it between 0% and 100% for reliable charts.
- 6
Display KPI cards at the project level (current, start, target, progress) to create a feedback loop from metrics to task planning.
- 7
When progress stalls, translate the KPI gap into concrete task changes (e.g., content iteration like title/thumbnail updates).