Daylio App - Advanced Statistics Explained
Based on Duddhawork's video on YouTube. If you like this content, support the original creators by watching, liking and subscribing to their content.
Daily’s advanced stats quantify mood frequency, streak length, and activity correlations within selectable time windows (e.g., last 30 days, last year, all time).
Briefing
Mood tracking becomes actionable when Daily turns raw check-ins into comparisons: which moods show up most, which activities tend to move mood up or down, and how those patterns vary by streaks and days of the week. In a 30-day snapshot, the user’s “life is good” mood appears 9 times out of 30 days, up from 5 times in the prior 30-day window—an increase of about 80%. But the app’s own context matters: “life is good” is also rated around 4/5 for them, so frequency alone doesn’t automatically mean things are improving; it’s a starting signal that needs follow-up.
Daily’s advanced stats also track how long a mood lasts and what it tends to cluster with. For “life is good,” the longest streak runs from Feb 25 to Feb 27, and the “longest streak without that mood” is about 8 days—an expected outcome when multiple moods can exist within a mood group. The app then links moods to related activities. For example, “paying proper attention” (including walking in silence and meditating) sits around 40, while most other activities fall in the 33–29 range. The user notes that patterns become more reliable only after enough data accumulates; with sparse activity tracking, correlations can look strong but carry low confidence.
The stats extend from single moods to mood groups—especially useful for asking when someone feels their best. For a top mood group (5/5), the user reports 362 times per month since tracking began (about 8.5 entries per month, roughly two days per week), with a longest 5/5 streak of four days and 23 days without feeling really good. Still, the app’s correlation charts can be misleading when activities are too rare or too specific. The user says they eventually narrowed tracking to about 10 standardized activities to improve statistical signal.
Day-of-week patterns add another layer. For the 5/5 mood group, Monday is the lowest incidence day (41 times), while Friday peaks and the weekend dips—Sunday and Saturday are close, with Sunday slightly lower (55 vs 58). These weekly rhythms don’t prove causation, but they help identify routines worth testing.
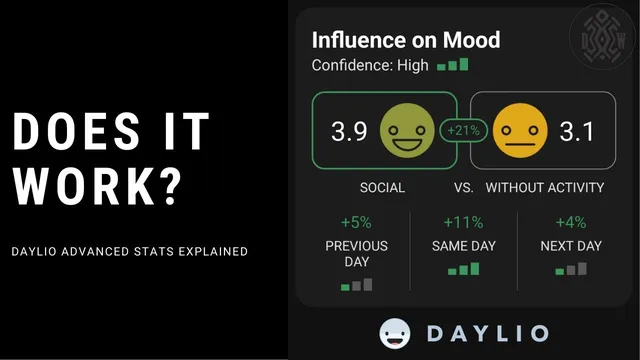
At the activity level, Daily compares average mood on days with an activity versus days without it, plus “previous day” and “next day” effects. Walking is the clearest example: across all time, mood averages 3.9 on walking days versus 3.6 on non-walking days (about a 9% relative boost). Confidence is described as high because both groups have enough samples, though the user cautions that “previous day” and “next day” effects can be hard to interpret—sometimes they may reflect anticipation rather than the activity itself. Social shows a larger contrast: 3.9 on social days versus 3.1 on non-social days, with additional carryover into adjacent days. Finally, when there’s no data for a mood group (like 1/5 in the last 30 days), Daily withholds comparisons and flags the need for more entries.
Cornell Notes
Daily’s advanced statistics turn mood check-ins into measurable patterns: which moods and mood groups appear most, how long they last, and which activities correlate with higher or lower ratings. The user demonstrates this with a 30-day view (e.g., “life is good” rising from 5 to 9 occurrences) and then expands to longer-term mood-group behavior, including streaks and day-of-week incidence. Activity analysis compares average mood on “with activity” versus “without activity” days and also reports previous-day and next-day comparisons. The key takeaway is that correlations become more trustworthy with standardized activities and enough sample size; rare or overly specific activities can produce misleading confidence. Weekly patterns (like Monday being lowest for 5/5) help guide what to test next.
How does Daily quantify whether a mood is happening more often, and why can that be misleading?
What do “longest streak” and “longest streak without that mood” add beyond raw counts?
Why does the user emphasize tracking fewer, more standardized activities?
How does Daily interpret activity effects across the same day, previous day, and next day?
What day-of-week pattern emerges for the top mood group (5/5), and what does it imply?
How do walking and social illustrate the difference between “small lift” and “big lift” correlations?
Review Questions
- When comparing mood frequency across two 30-day windows, what additional metrics (like streaks or intensity ratings) should be checked before concluding an improvement?
- Why can rare activities produce misleadingly high correlation percentages, and how does standardizing activity tracking address that?
- How would you interpret a positive “previous day” effect for an activity without assuming it proves causation?
Key Points
- 1
Daily’s advanced stats quantify mood frequency, streak length, and activity correlations within selectable time windows (e.g., last 30 days, last year, all time).
- 2
An 80% increase in a mood’s occurrence can still be ambiguous if the mood’s intensity rating and context differ across periods.
- 3
Streak metrics reveal persistence and gaps, which frequency counts alone can’t show—especially when multiple moods share the same mood group.
- 4
Correlation confidence improves when activities are standardized and tracked often enough; rare or archived activities can inflate apparent effects.
- 5
Daily’s activity analysis includes same-day, previous-day, and next-day comparisons, but adjacent-day effects can reflect anticipation or reporting structure (multiple mood entries per day).
- 6
Weekly incidence patterns (like Monday being lowest for 5/5) can guide hypotheses about routines, even though they don’t establish causation.
- 7
When there’s insufficient data for a mood group (e.g., 1/5 in the last 30 days), Daily withholds comparisons and signals the need for more entries.