Daylio App Review: Analyzing 1000+ Days of Data
Based on Duddhawork's video on YouTube. If you like this content, support the original creators by watching, liking and subscribing to their content.
Daylio daily mood is computed as the average of all mood entries recorded on that day, which matters when multiple entries occur in one day.
Briefing
A 1,000-day mood log in Daylio suggests a stable personal baseline rather than a steady upward trend: the average mood settles around 3.7 on a 1–5 scale, with typical day-to-day variation of about 1.2 (so most entries fall roughly between 2.5 and 4.9). After an initial dip and a gradual leveling period, the cumulative mood curve flattens—meaning the long-run question “am I getting happier over time?” doesn’t show a clear improvement, and the “am I getting more stable?” question also lands on “not really.”
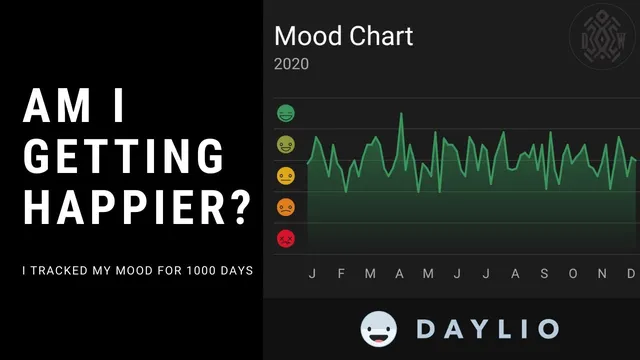
The analysis starts with how mood is recorded. Daylio entries map a user’s overall mood to a 1–5 rating (with custom sub-moods such as “life is good,” “grateful,” “meaningful,” “zen,” “mad,” and “angry”). The log includes multiple entries on some days—capturing different moods at different times—so the daily mood is treated as the average of that day’s entries (for example, combining a 1 and a 4 yields a 2.5 average). The most common daily rating lands on 4 out of 5, followed by 5, then 2, then 3, with 1 the least frequent. Subcategory breakdowns reinforce that “life is good” and positive frames appear more often than “zen,” while “angry” dominates the low-end category.
To answer the two core questions, the creator uses cumulative averages and dispersion measures. The cumulative average mood is computed day by day: each new day’s rating updates the running mean of all prior days, producing a curve that can reveal whether the baseline is drifting upward or downward. Over the multi-year span (roughly 2018 to 2021), the cumulative mood appears to stabilize after about six months, hovering near 3.7. A parallel look at cumulative standard deviation—used as a measure of variability—stays steady around 1.2, indicating that mood volatility doesn’t meaningfully shrink as time passes.
A key nuance is scale. Even when plots look like they fluctuate, the changes are small in absolute terms: the smoothed trend moves only from about 3.8 down to roughly 3.6–3.7. On a 1–5 axis, that’s a narrow band, and the error bars remain relatively constant. The practical takeaway is a quantified baseline: mood is “about 3.7 ± 1.2,” not a steadily rising line.
The discussion then broadens beyond statistics into interpretation. The creator questions whether different “types” of happiness (for instance, “meaningful” versus “blissful” versus “grateful”) are interchangeable on a single 1–5 scale, whether an “ideal” distribution would be all 5s (or whether variability is inherently human), and whether modern improvements in external conditions translate into greater subjective happiness. The final personal reflection is existential: if life’s baseline is stable rather than improving, what does it mean to keep striving—and is chasing happiness a dead end or a necessary pursuit of something other than mood alone?
Overall, the dataset turns a vague self-assessment into a measurable claim: long-term mood stability is real, but long-term improvement is not obvious in this record.
Cornell Notes
Daylio mood tracking over roughly 1,000 days yields a stable baseline rather than a clear upward trend. Daily mood is computed as the average of multiple entries when they occur in the same day, using a 1–5 scale. The most frequent daily rating is 4, with 5 next most common, and 1 the least common. Cumulative analysis shows the running average settles around 3.7, while variability measured by standard deviation stays around 1.2, implying typical days fall roughly between 2.5 and 4.9. The result reframes “getting happier” as a question of baseline and variability, not just occasional high moods.
How does the analysis convert Daylio entries into a single daily mood score?
What does the mood distribution reveal about “typical” days?
How is “getting happier over time” tested using cumulative averages?
How is “getting more stable over time” measured?
Why do the plots sometimes look more variable than the underlying numbers?
What is the final quantified baseline claim from the dataset?
Review Questions
- If a day has three mood entries (2, 4, and 5), what daily mood score would the analysis assign, and where would it likely fall relative to the typical range?
- What would a rising cumulative average curve imply about long-term happiness, and how does the observed stabilization near 3.7 change that interpretation?
- Why might two people with the same average mood (e.g., 3.7) still experience different day-to-day lives if their standard deviations differ?
Key Points
- 1
Daylio daily mood is computed as the average of all mood entries recorded on that day, which matters when multiple entries occur in one day.
- 2
Across about 1,000 days, the most common daily mood rating is 4 out of 5, with 5 next most common and 1 the least common.
- 3
Cumulative averaging shows the long-run mood baseline stabilizes around 3.7 rather than trending upward.
- 4
Mood stability is assessed with standard deviation; the cumulative standard deviation stays around 1.2, indicating variability doesn’t steadily decrease.
- 5
Most recorded daily moods fall roughly between 2.5 and 4.9 when combining the mean (3.7) with the typical variation (±1.2).
- 6
Small visual fluctuations on a 1–5 chart can represent minor absolute changes (on the order of 0.1 points) even when the curve looks busy.
- 7
The analysis shifts the interpretation of “happiness” from chasing higher peaks to understanding baseline and variability over time.