How Knowledge Analytics Works and How To Use Them
Based on APQC's video on YouTube. If you like this content, support the original creators by watching, liking and subscribing to their content.
Start KM deployments by identifying business drivers, then align KM strategy and investments to business strategy before choosing tools or communities.
Briefing
Knowledge analytics is a repeatable, feedback-driven way to deploy knowledge management (KM) approaches, measure whether they create business value, and then adjust or restart until results match business goals. Instead of treating KM tools like one-off rollouts, the process starts with business priorities, aligns KM investments to those priorities, tests KM approaches, and uses data plus critical judgment to decide whether to iterate, expand, or stop.
The workflow begins by choosing and deploying KM capabilities—ranging from turning on features inside existing software to buying new tools or building communities such as discussion forums, wikis, communities of practice, or social platforms. Once the KM approach is live, teams collect usage and sentiment data: how many people use it, whether non-participating groups exist, and whether users like or dislike the tool. Success metrics can also include value-oriented measures such as time saved, money saved, learning gains, and faster time to competency, along with qualitative signals like user complaints and praise.
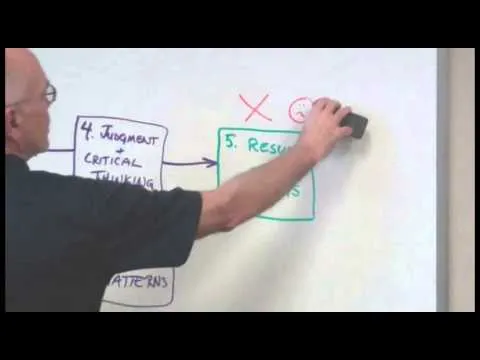
After raw metrics are gathered, the process shifts from measurement to analysis. Teams look for patterns: Is adoption rising or stalling? Are there signs of added value, or unintended consequences? The decision-making step combines “insight, judgment, and objective critical thinking” to assess whether the KM tool is doing what it was meant to do, whether benefits show up that weren’t anticipated, and what changes could increase usage or improve effectiveness. That can mean targeted training for underutilized areas, fixes to address user friction, or better analytics capabilities to evaluate value more accurately.
The loop then closes with a clear fork in the road. If results don’t meet expectations, teams go back to redeploy with changes—effectively restarting the deployment cycle. If outcomes look strong, teams report results to the business in concrete terms: time saved, headcount impact, cost savings, or revenue gains. Even strong results can trigger a reset if business priorities shift, reinforcing that KM alignment must stay current.
A key twist reframes the earliest step: step one can be understanding business drivers rather than immediately deploying a KM tool. Business landscapes change, so the process can start with near-term business focus, annual business metrics, or long-term strategy where KM is a critical success factor. Next comes alignment—matching KM strategy and investments to business strategy—followed by a hypothesis-driven test using a scientific-method mindset. The KM program feedback loop then runs through deployment, measurement, analysis, and reporting until outcomes quantify alignment with business objectives. The approach is formalized as “knowledge analytics,” and it’s positioned as a way to improve decision quality by adding knowledge analytics alongside other analytics domains such as workforce analytics, social analytics, and supplier analytics.
Cornell Notes
Knowledge analytics turns KM into a measurable, iterative program tied to business goals. Teams start by identifying business drivers, align KM strategy and investments to those priorities, and then test KM approaches using a hypothesis-driven mindset. After deployment, they collect adoption and sentiment metrics (usage counts, likes/dislikes) plus value metrics such as time saved, money saved, learning gains, and faster time to competency. Analysis looks for patterns, unintended consequences, and evidence of added value, then leads either to redeployment with changes or reporting quantified results to the business. If priorities shift or results miss expectations, the cycle restarts to keep KM aligned.
What does a typical knowledge analytics cycle do after a KM approach is deployed?
How does the process move from measurement to decision-making?
What are the main actions after analysis—redeploy or report?
Why does the framework sometimes start with business drivers instead of tool deployment?
How does the scientific-method idea fit into KM program design?
Review Questions
- What specific metrics would you collect to evaluate both adoption and business value after deploying a KM tool?
- How would you decide whether to redeploy with changes versus reporting results to leadership?
- How does starting with business drivers change the way KM approaches are selected and tested?
Key Points
- 1
Start KM deployments by identifying business drivers, then align KM strategy and investments to business strategy before choosing tools or communities.
- 2
Deploy KM approaches in multiple forms—software features, new capabilities, forums, wikis, communities of practice, or social platforms—and treat rollout as a testable intervention.
- 3
Measure adoption and sentiment (usage counts, who is not using it, likes/dislikes) alongside value metrics like time saved, money saved, learning gains, and faster time to competency.
- 4
Use analysis to detect patterns, quantify value added, and surface unintended consequences before making decisions.
- 5
Apply objective critical thinking to judge whether KM approaches are meeting intended outcomes and to determine what changes could improve usage.
- 6
Close the loop by either redeploying with improvements or reporting quantified results; be ready to restart if business priorities shift.
- 7
Run the process as an iterative feedback loop—framing it as “knowledge analytics” to keep KM continuously aligned with business objectives.