How To Build A Progress Bar In Notion: Project Manager (Part 2)
Based on Red Gregory's video on YouTube. If you like this content, support the original creators by watching, liking and subscribing to their content.
Connect Projects to Tasks using a Relation property so each project can reference its subordinate tasks.
Briefing
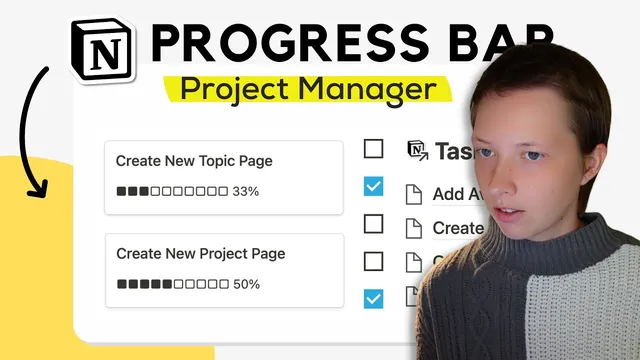
A Notion project progress bar can be built by linking each project to its tasks, rolling up a “done” checkbox into a percent, and then turning that percent into a string of filled and empty squares using formula functions. The payoff is practical: checking off tasks automatically updates each project’s progress from 0% to 100% without manual editing.
The setup starts in the Projects database. A relation property named (or effectively used as) “tasks” connects each project to rows in a separate Tasks database via Notion’s Relation property. Inside Tasks, each task includes a “done” checkbox and a link back to its project through the relation. With that relationship in place, progress becomes a data problem: how many related tasks are checked?
To convert checkbox completion into a percentage, a new rollup property (named “percent done”) is added to Projects. The rollup uses the relation to Tasks, then targets the “done” checkbox field, calculating “percent checked.” That rollup value becomes the numeric input for the progress bar.
The visual bar itself is a formula property that outputs text. Using the slice function, the formula builds a fixed-length string of 10 characters: filled-square symbols for completed portions and empty-square symbols for the remainder. The filled portion count is derived by multiplying the percent done (0–1 range) by 10, then flooring the result so the bar advances in whole-square steps. The empty portion is generated with a second slice that takes the complement of the filled count.
A key edge case is handled with an if statement: percentages below 10% would otherwise produce zero filled squares, leaving the bar visually empty when it shouldn’t be. The formula forces at least one filled block when percent done is under the threshold, then falls back to the slice-based logic for the rest.
Finally, the progress bar formula appends the numeric percentage to the end of the squares. Because the slice outputs text, the percent value is converted to text using format, then multiplied by 100, floored, and concatenated with a “%” sign.
To make the system usable day-to-day, the workflow recommends a simple dashboard-like page. It embeds linked database views: a checklist-style linked view of Tasks where users tick off “done,” and a gallery-style linked view of Projects where each project’s progress bar updates live. Linked views don’t alter the original databases; they only reflect changes back to the source. The result is a clean project manager interface where task completion automatically drives project-level progress visualization.
Cornell Notes
The progress bar is built by connecting Projects to Tasks with a Relation property, then using a rollup to compute “percent done” from each task’s “done” checkbox. A formula property turns that percent into a fixed 10-character string: filled squares for completed work and empty squares for the remainder, using the slice function. Flooring ensures the bar moves in whole-square increments. An if statement prevents the bar from showing zero filled blocks for small completion levels (below the threshold). The percentage is appended to the bar by converting the numeric rollup into text with format and concatenating it with a “%” sign. Linked database views provide a dashboard where ticking tasks updates project progress automatically.
How does the Projects database learn which tasks belong to each project?
What property turns task checkboxes into a usable percent for the progress bar?
How does the formula create a progress bar made of filled and empty squares?
Why is an if statement needed in the progress bar formula?
How is the numeric percentage appended to the bar without type errors?
How do linked database views make the progress bar practical to use?
Review Questions
- What rollup calculation is used to derive “percent done” from related tasks, and which task property does it target?
- How do slice, floor, and concatenation work together to ensure the progress bar always has exactly 10 characters?
- What problem does the if statement solve for progress values below the 10% threshold?
Key Points
- 1
Connect Projects to Tasks using a Relation property so each project can reference its subordinate tasks.
- 2
Add a rollup on Projects that calculates “percent checked” from the Tasks “done” checkbox to produce percent done.
- 3
Build the progress bar as a formula that outputs text using slice to generate a fixed-length (10-character) filled/empty square string.
- 4
Use floor(10 * percent done) so the bar advances in whole-square steps rather than fractional characters.
- 5
Add an if condition so early progress (below 10%) still shows at least one filled square instead of appearing empty.
- 6
Append the percentage to the bar by converting the numeric rollup to text with format and concatenating a “%” sign.
- 7
Create a dashboard page with linked database views so checking tasks in the Tasks view automatically updates project progress in the Projects view.