How to Report Moderation Analysis Results from SPSS
Based on Research With Fawad's video on YouTube. If you like this content, support the original creators by watching, liking and subscribing to their content.
Run the moderation model twice in SPSS: once without the interaction term and once with the interaction term (CC × role ambiguity).
Briefing
Role ambiguity weakens the positive relationship between collaborative culture and organizational performance, and the moderation effect is statistically significant in SPSS. In the model without the interaction term, collaborative culture and role ambiguity explain 34.8% of the variance in organizational performance (R² = 0.348). When the interaction term (collaborative culture × role ambiguity) is added, explained variance rises to 36.3% (R² = 0.363), an increase of 1.5 percentage points—evidence that the interaction contributes additional explanatory power beyond the main effects.
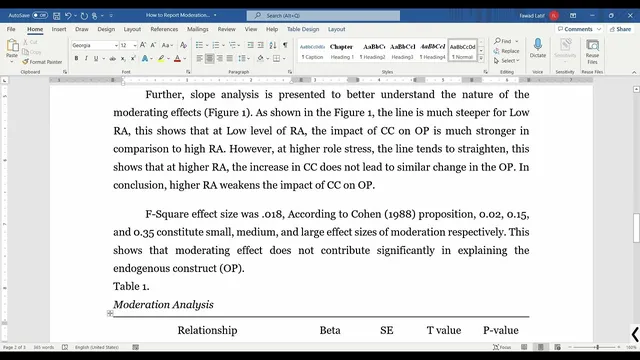
The interaction term is significant and negative, with a beta of −0.095. The corresponding t statistic is −2.741 and the p value is 0.06, which supports the hypothesis that role ambiguity negatively moderates the CC → organizational performance link. Interpreted plainly: collaborative culture is associated with higher organizational performance when role ambiguity is low, but that benefit diminishes as role ambiguity increases. The moderation slope analysis reinforces this pattern by comparing the steepness of the lines on the interaction plot. The line for low role ambiguity is steeper, meaning increases in collaborative culture translate into larger gains in organizational performance. At high role ambiguity, the line flattens, indicating that raising collaborative culture no longer produces the same improvement in organizational performance.
For reporting, the transcript lays out a practical checklist for moderation results: include R² with and without the interaction term, the path coefficients (including the interaction beta), the test statistics and p value for the interaction, the slope interpretation from the moderation plot, and an effect size for the moderation. The effect size is computed using Cohen’s f² for the incremental contribution of the interaction: f² = (R²_included − R²_excluded) / (1 − R²_included). Using R²_included = 0.363 and R²_excluded = 0.348 yields f² = 0.02.
Using Cohen’s benchmarks (0.02–0.15 small, 0.15–0.35 medium, and above 0.35 large), the moderation effect size is small. The overall takeaway is that role ambiguity matters, but its incremental explanatory impact is modest: it significantly weakens the collaborative culture advantage, yet the additional variance explained by the interaction term is relatively limited. The transcript also notes a common sign-checking pitfall—ensuring the interaction’s negative sign is reflected correctly in the interpretation of which line is steeper on the plot—so the narrative matches the statistical direction.
Cornell Notes
The moderation analysis tests whether role ambiguity changes the strength of the relationship between collaborative culture (CC) and organizational performance (OP). Without the interaction term, the model explains 34.8% of OP variance (R² = 0.348). Adding the interaction increases R² to 36.3% (R² = 0.363), a 1.5 percentage-point gain, indicating the interaction adds explanatory value. The interaction coefficient is negative (β = −0.095) and statistically significant (t = −2.741, p = 0.06), so higher role ambiguity weakens the positive CC → OP relationship. Slope analysis shows a steeper CC effect at low role ambiguity and a flatter effect at high role ambiguity. The moderation effect size is small (f² = 0.02).
Why does the analysis require R² “with” and “without” the interaction term?
How is the moderation effect interpreted when the interaction beta is negative?
What does the slope (interaction plot) reveal, and how should steepness be used?
How is f² for moderation calculated from SPSS output?
What does an f² of 0.02 imply about practical importance?
Review Questions
- What are the specific R² values used to compute the moderation effect size, and what does each represent?
- How do the sign of the interaction beta and the slope-plot steepness jointly determine whether the moderator strengthens or weakens the CC→OP relationship?
- Using the provided formula, how would you compute f² if R²_included and R²_excluded were different?
Key Points
- 1
Run the moderation model twice in SPSS: once without the interaction term and once with the interaction term (CC × role ambiguity).
- 2
Report R² for both models (R²_excluded and R²_included) to show the incremental variance explained by moderation.
- 3
Use the interaction term’s beta, t statistic, and p value to support or reject the moderation hypothesis.
- 4
Interpret moderation direction using the sign of the interaction beta: a negative beta means the moderator weakens the main relationship.
- 5
Use slope analysis by comparing line steepness at low versus high moderator values to describe how CC affects OP under different role ambiguity levels.
- 6
Compute moderation effect size with Cohen’s f²: (R²_included − R²_excluded) / (1 − R²_included), and interpret it with Cohen’s small/medium/large benchmarks.
- 7
In this case, role ambiguity significantly weakens the CC → OP relationship, with a small effect size (f² = 0.02).