My Productive 2023 Notion Setup: Free Template! (*20 databases)
Based on Red Gregory's video on YouTube. If you like this content, support the original creators by watching, liking and subscribing to their content.
The glossary acts as a central tagging hub, linking themes across books, quotes, web links, and notebook notes through relations.
Briefing
A Notion dashboard built around one idea—everything connects through shared relations—turns daily journaling, task management, reading, fitness, finances, and knowledge management into a single system that can be filtered, rolled up, and analyzed by month. The core payoff is practical: tasks roll into timelines and progress bars, reading sessions feed book progress, food logs feed recipes and a shopping list, and transactions roll into budget alerts—so the workspace produces metrics without manual spreadsheet work.
At the top, the setup anchors the year with two linked utilities: a 2023 countdown database that uses formulas to track year, month, and week progress, and a glossary that acts like a hub for tags. The glossary connects to multiple databases through a “tags property” approach, letting items like books, quotes, and web links inherit themes such as “attainment” or “desire.” A key example is the “genres” view: genres are filtered from glossary entries, then book covers are assembled via a roll-up from the books database, producing a visual bookshelf navigation.
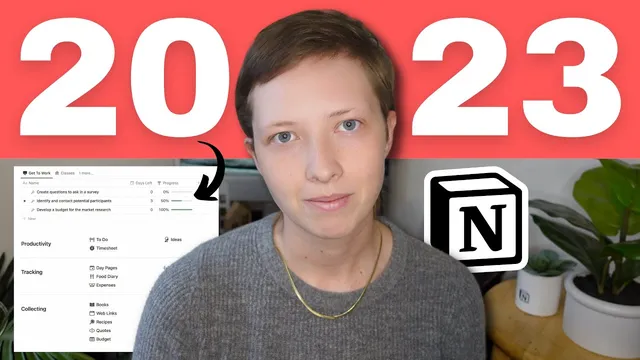
The productivity layer centers on a to-do system that supports nested work. Tasks include status, priority, difficulty, start and due dates, and formulas that flag “overdue” when the due date is past and the task isn’t complete. A major feature is subtasks implemented with Notion’s “sub items” option: parent tasks can contain subtasks, and the progress bar only reaches 100% once all subtasks are completed. The same structure can be viewed as a timeline, where date ranges can be dragged, and filtered “get to work” lists can surface only what’s due or incomplete.
Beyond tasks, the dashboard adds quick tasks, ideas, and a timesheet workflow. Templates let “ideas” become tasks, and tasks can spawn time-tracking sessions with start/end times. Each work session can calculate hours worked and, for consulting-style tracking, compute invoice totals using an hourly rate. Archived work sessions disappear from active views and reappear in month-based archives.
Tracking expands through month-based “day pages” and linked databases. Each month (January through December) contains day pages where habits, water, coffee, strength, and mood are logged per date. Reading sessions connect to a bookshelf: adding a reading log automatically updates book hours, pages read, and a progress bar computed from roll-ups of pages read. Food logging connects to recipes (with meal-type views like breakfast through dinner), and recipe templates link to a simplified shopping list for ingredient purchases.
Fitness and finances follow the same relational pattern. Workouts are logged as sets tied to exercises, and exercises maintain an activity history. Finances split into budgets, expenses, and income, with roll-ups calculating “total spent” per budget category and formulas triggering over-budget alerts. Analytics at the month level use roll-ups to compute totals (income vs. expenses) and habit metrics (e.g., average coffee intake, water progress toward an ounce goal, and completion rates).
Finally, knowledge management is integrated through web links and a notebook system. Web links are categorized by type (academic links, Twitter, YouTube, images, tools like Canva or Google AdSense) and can be clipped into note bodies. Notes connect back to sources, themes from the glossary, courses, and related notes, with an “add to do” bridge that turns lecture homework into the task system. A “today” class view uses a formula to route scheduled courses into a daily list, completing the dashboard’s end-to-end workflow.
Cornell Notes
The dashboard is built as a network of linked Notion databases where relations and roll-ups do most of the heavy lifting. A glossary hub connects tags/themes to books, quotes, web links, and notebook notes, enabling fast retrieval and consistent categorization. Productivity uses parent tasks with subtasks (“sub items”), so progress bars and overdue logic update automatically based on due dates and completion status. Monthly pages then aggregate daily logs—habits, water/coffee, mood, reading sessions, food, fitness, and finances—so analytics like totals, balances, and over-budget alerts appear without manual recalculation. The result is one system that turns logging into metrics and metrics into next actions.
How does the glossary function as the “glue” across the system?
What makes the task progress logic reliable when subtasks are involved?
How does the dashboard turn reading logs into book progress?
How are monthly analytics produced from daily tracking?
What is the finance workflow that triggers budget alerts automatically?
How does knowledge management connect sources to notes and then to tasks?
Review Questions
- Which relations and roll-ups are responsible for updating task progress, and how do subtasks change the completion logic?
- Describe how a single glossary theme can surface related books, quotes, and web links—what properties connect them?
- How do month-level progress bars (coffee, water, habit completion, reading hours) derive their numbers from day pages and reading logs?
Key Points
- 1
The glossary acts as a central tagging hub, linking themes across books, quotes, web links, and notebook notes through relations.
- 2
Task progress bars are driven by parent–subtask relationships, so completion only reaches 100% when all subtasks are finished.
- 3
Overdue and “working period” logic are handled with formulas based on start/due dates and task status, enabling automatic list filtering.
- 4
Monthly “day pages” serve as the aggregation layer for habits, mood, water, and coffee, while roll-ups compute month-level averages and progress bars.
- 5
Reading sessions connect to the bookshelf so pages read roll up into book progress bars and reading-hour totals.
- 6
Food logging connects to recipes and templates that link to a mobile-friendly shopping list checklist.
- 7
Finances use roll-ups from expenses into budget categories, with formulas that flag over-budget items and compute how far over the limit they are.