Notion Build With Me: My Timeline View Setup
Based on Red Gregory's video on YouTube. If you like this content, support the original creators by watching, liking and subscribing to their content.
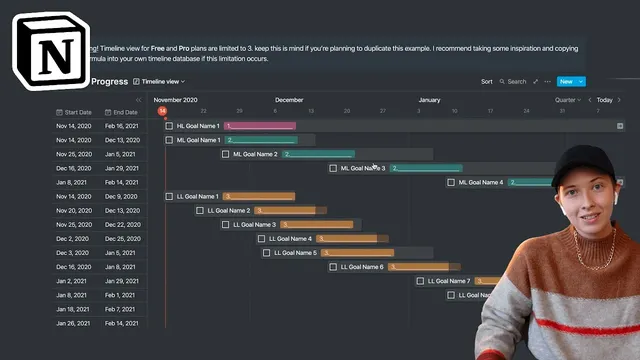
Use “/timeline” to add Timeline View, but plan around caps on timeline views (free: 3; Pro: 3; Team: 5).
Briefing
Notion’s newly added Timeline View features—especially the ability to hide properties—make it practical to build a cleaner, more scalable project-management system without drowning in dozens of database fields. The setup described here uses Timeline View to manage goal hierarchies (milestones → mid-level goals → low-level tasks), automatically tracks completion through rollups, and turns progress into a visual “progress bar” using formulas and emojis.
The workflow starts with inserting a Timeline View via “/timeline,” choosing whether it renders inline or full page. A key constraint remains: free plans are limited to three timeline views, while Pro also caps at three and Team at five. To keep things manageable, the creator sticks to one timeline view and then customizes it heavily.
Goals are structured as cards on the timeline. Each card initially holds a start date and end date, with Timeline View configured to use separate start and end properties (via Timeline by → start/end date preferences). The view is then made more usable by toggling which properties appear on the cards and in the table sidebar. Zoom levels—quarter, month, bi-weekly, week, and even day/hour—are used to shift from high-level planning to near-term execution.
To represent progress across a hierarchy, the system adds a checkbox for completion and a relation property (“children tasks”) that links each parent goal to its child tasks. A rollup property (“child progress”) calculates completion by referencing children tasks’ completion status and percent checked. When child tasks are marked complete, the rollup updates automatically—so a parent goal reflects how far along it is (for example, three mid-level tasks completing can yield a rollup like 75%). That rollup is then hidden to keep the interface tidy.
The visible progress bar is created with a formula property (“progress”) that uses Notion’s slice function to display a row of bolt emojis, placing a check mark at the appropriate threshold based on the rollup value. A second refinement formats the rollup into a whole-number percentage (multiplying by 100) and appends a “%” sign. An IF statement prevents clutter by showing a blank when the rollup is empty, eliminating noisy “0%” displays for goals without children.
Finally, the system addresses timeline clutter by adding an “archive” view. A separate table view filters for completed items (complete checkbox ticked) so finished tasks disappear from the main timeline and reappear in the archive. Daily tasks can include times by enabling “include time” and dragging cards along the timeline to schedule them. The result is a timeline that supports both long-range goal planning and day-by-day execution, while keeping the interface readable through hidden properties, rollups, and filtered views.
Cornell Notes
A Notion Timeline View can be turned into a goal-and-project tracker by combining separate start/end dates, a completion checkbox, parent-child relations, and rollups. The hierarchy uses “milestone” (high level), “mid-level goals,” and “low-level tasks,” connected through a relation property (“children tasks”) with sync both ways. A rollup (“child progress”) computes completion from children tasks, then a formula (“progress”) converts that rollup into a visual progress bar using bolt emojis and a check mark at the right threshold. Formatting adds a whole-number percentage, while an IF statement hides the progress bar when a goal has no children. An additional filtered archive view removes completed tasks from the main timeline to reduce vertical clutter.
How does the setup make Timeline View use both start and end dates instead of only one date?
What’s the mechanism for rolling up progress from child tasks to a parent goal?
How is the emoji progress bar built from the rollup value?
How does the system avoid showing “0%” or an empty-looking progress bar for goals without children?
What’s the approach for keeping the timeline from becoming a long vertical list as tasks accumulate?
How are daily tasks scheduled with times on the timeline?
Review Questions
- What properties and settings are required to make Timeline View render a card across a date range (start and end) rather than a single date?
- Describe how a rollup value is computed from child tasks and then transformed into an emoji-based progress bar.
- Why create a separate archive view, and what filter condition keeps completed tasks out of the main timeline?
Key Points
- 1
Use “/timeline” to add Timeline View, but plan around caps on timeline views (free: 3; Pro: 3; Team: 5).
- 2
Configure Timeline View to use separate start and end date properties so cards span the intended time range.
- 3
Model goal hierarchy with a relation property (“children tasks”) and compute parent progress using a rollup based on children completion.
- 4
Generate a visible progress bar with a formula that slices a fixed set of emojis and places a check mark based on the rollup value.
- 5
Format the rollup into a whole-number percentage and suppress output when the rollup is empty to avoid clutter.
- 6
Reduce timeline clutter by filtering completed tasks into a separate archive view while keeping the main view focused on active items.
- 7
Schedule day-level tasks by enabling “include time” and dragging cards along the timeline to set their time slots.