Notion For Mental Clarity: A Brain Dump Dashboard (Tutorial)
Based on Red Gregory's video on YouTube. If you like this content, support the original creators by watching, liking and subscribing to their content.
Use one master Notion database (“inventory”) as the single landing zone for all ideas and tasks.
Briefing
A Notion “mental clarity” dashboard can turn a messy brain dump into a structured system by funneling every idea into one master database, then automatically surfacing the right items in separate area views (home, work, health, and more). The core workflow is simple: capture everything as new entries in a single inventory table, tag each entry with properties like Area, Difficulty, Time frame, and Motivation, and then build linked database callouts that filter the master list into focused sections.
The setup starts with an “inventory” database that acts as the catch-all. Each new thought becomes a database entry, and the template adds select properties to make sorting and filtering practical. “Area” uses dropdown options (for example, health, home, work), while “Difficulty,” “Time frame,” and “Motivation” provide additional structure. A “done” checkbox supports tracking progress. The template also encourages customizing which properties appear, letting users hide or show specific fields so the interface stays clean.
Sorting is tuned for how people actually decide what to do next. Instead of relying on alphabetical order, the dashboard sorts based on the dropdown order for fields like Difficulty. The creator sets Difficulty to descending so low difficulty appears first (easier wins up top), then applies additional sorts such as Motivation ascending and Time frame ascending.
To make repeated capture effortless, the database uses templates for common difficulty levels. Each difficulty option is paired with a unique icon (including a lightning-bolt style icon set provided via a downloaded media kit). When adding a new entry, the user selects the appropriate template, which preconfigures the entry with the right icon and baseline fields.
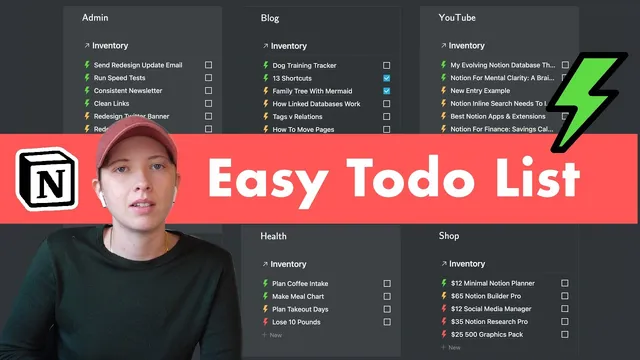
The dashboard itself is built from callouts that each contain a linked database view filtered to a specific Area. The key move is creating linked database portals from the original inventory database, then applying filters so each callout only shows items for its assigned area (e.g., Blog content, YouTube, Social, Health, Shop, Admin). These linked views inherit the same sorting rules, and new tasks added inside any callout automatically appear in the master list.
From there, the dashboard scales into a more flexible “board view.” Grouping by Area creates collapsible sections, and grouping by the Done checkbox lets users separate finished from unfinished work. Users can also hide empty groups, color-code columns based on dropdown colors, and drag items to reorganize the board. Quick duplication shortcuts (like duplicating callouts) make it easy to add new areas without rebuilding filters from scratch.
Overall, the system matters because it reduces decision fatigue: brain fog turns into a prioritized, trackable backlog where every idea has a home, a difficulty level, a time horizon, and a clear next step—without losing the convenience of a single master list.
Cornell Notes
The mental clarity dashboard is built around one master Notion database (“inventory”) where every idea lands as a new entry. Each entry gets structured properties—Area, Difficulty, Time frame, Motivation—and a Done checkbox for progress tracking. Sorting is configured to reflect dropdown order (not alphabetical), with Difficulty arranged so low difficulty items appear first, followed by Motivation and Time frame rules. The dashboard then uses linked database callouts filtered by Area, so each section shows only the relevant tasks while still updating the master list. A board view adds collapsible grouping by Area and optionally by Done status, making it easier to scan what’s finished versus what’s next.
How does the template turn a free-form brain dump into something actionable?
Why does the template emphasize dropdown order for sorting Difficulty?
What makes the dashboard sections update automatically without duplicating data?
How are difficulty templates and icons used to speed up entry creation?
How does the board view improve scanning and planning?
What’s the fastest way to expand the dashboard to new areas?
Review Questions
- If Difficulty sorting follows dropdown order rather than alphabetical order, what must be adjusted to change priority?
- How does a linked database callout differ from creating a separate database for each area?
- What grouping choices in the board view help separate “finished” from “next actions”?
Key Points
- 1
Use one master Notion database (“inventory”) as the single landing zone for all ideas and tasks.
- 2
Add structured properties—Area, Difficulty, Time frame, Motivation—and a Done checkbox to every entry.
- 3
Arrange dropdown option order for Difficulty so sorting matches real-world prioritization (easier items first).
- 4
Create dashboard sections as linked database callouts filtered by Area, so updates flow to the master list automatically.
- 5
Use database templates for common patterns (like low/medium/high difficulty) and attach icons to speed up entry creation.
- 6
Build a board view grouped by Area and optionally subgrouped by Done to quickly distinguish unfinished work from completed items.
- 7
Duplicate filtered callouts to add new areas with minimal setup—only change the title and the Area filter.