PLS-SEM Thresholds Explained: Complete Guide for Researchers
Based on Research With Fawad's video on YouTube. If you like this content, support the original creators by watching, liking and subscribing to their content.
Use outer loadings ≥ 0.70 as the default indicator reliability threshold in PLS-SEM.
Briefing
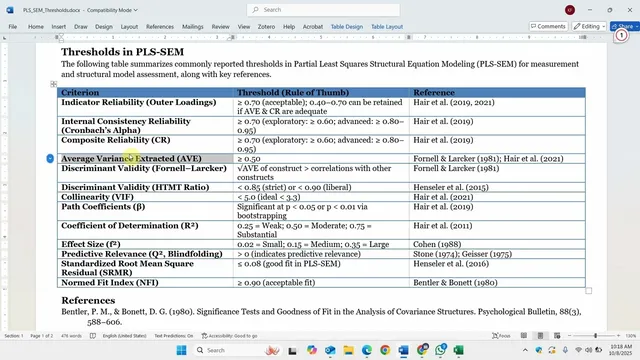
PLS-SEM threshold rules for both measurement and structural models can be applied using a set of widely cited cutoffs—especially for outer loadings, reliability (Cronbach’s alpha and composite reliability), validity (AVE and discriminant validity tests), and structural significance (bootstrapped p-values, R², Q², and model-fit indices). The practical takeaway is that items and constructs aren’t judged by a single number: outer loading cutoffs interact with AVE and composite reliability, while discriminant validity depends on which criterion (Fornell–Larcker, HTMT, or collinearity checks) is used.
For the measurement model, indicator reliability starts with outer loadings. A common benchmark is outer loadings ≥ 0.70. When loadings fall in the 0.40–0.70 range, items may still be retained—but only if AVE and composite reliability are adequate. If AVE and composite reliability are not acceptable, those weaker-loading indicators (roughly 0.40–0.70) should be removed. This approach is tied to references such as Hair and colleagues (2019, 2021).
Internal consistency reliability is assessed using Cronbach’s alpha (often written as “alpha” or “chron batches alpha” in the transcript). The usual guideline is ≥ 0.70 for confirmatory contexts, while exploratory research can accept ≥ 0.60. Values above 0.95 are treated as potentially problematic (often interpreted as redundancy). Composite reliability is used as a more liberal alternative to Cronbach’s alpha and generally follows similar logic, with a typical target of ≥ 0.70.
Convergent validity uses AVE, with AVE ≥ 0.50 as the standard threshold. Discriminant validity has multiple routes. The traditional Fornell–Larcker criterion requires the square root of AVE for each construct to exceed its correlations with other constructs. Heterotrait–monotrait ratio (HTMT) is presented as stricter and more conservative at a cutoff of 0.85, while a more liberal threshold is 0.90. The transcript also notes a collinearity guideline: ideal HTMT/related collinearity values are around < 3.3, with < 5 considered acceptable.
For the structural model, path significance is typically judged via bootstrapping: p-values below 0.05 indicate significant paths and support hypotheses. In some fields, a more lenient threshold such as 0.01 may be used. Explanatory power is summarized with R² (coefficient of determination): 0.25 is weak, 0.50 moderate, and 0.75 substantial. Predictive relevance is assessed with Q², where values greater than zero indicate predictive relevance. Model fit is evaluated using SRMR, R and NFI: SRMR should be < 0.08, and NFI should be > 0.90.
Overall, the transcript frames PLS-SEM thresholds as a checklist of cutoffs backed by standard references, but with key decision points—particularly whether to keep indicators with loadings between 0.40 and 0.70 based on AVE and composite reliability.
Cornell Notes
PLS-SEM assessment thresholds span measurement quality (outer loadings, reliability, convergent and discriminant validity) and structural performance (bootstrapped path significance, R², Q², and model-fit indices). Outer loadings are commonly expected to be ≥ 0.70; indicators with loadings between 0.40 and 0.70 can be retained only if AVE and composite reliability are adequate. Reliability is checked via Cronbach’s alpha (≥ 0.70, or ≥ 0.60 for exploratory work) and composite reliability (typically ≥ 0.70), while convergent validity requires AVE ≥ 0.50. Discriminant validity can be tested with Fornell–Larcker (√AVE greater than cross-construct correlations) or HTMT (≤ 0.85 conservative, ≤ 0.90 liberal). Structural significance uses bootstrapped p-values (often < 0.05), with R² and Q² thresholds for explanatory and predictive relevance, plus SRMR (< 0.08) and NFI (> 0.90) for model fit.
What should researchers do when outer loadings fall between 0.40 and 0.70 in PLS-SEM?
How do Cronbach’s alpha and composite reliability differ in threshold expectations?
Which statistic is used for convergent validity, and what cutoff matters most?
How is discriminant validity evaluated using Fornell–Larcker versus HTMT?
What thresholds guide structural model assessment for path significance, R², and Q²?
Review Questions
- If a construct has outer loadings of 0.55 but AVE is below 0.50, what decision should be made about those indicators?
- Under what conditions would HTMT be judged acceptable at 0.90 versus 0.85?
- What combination of SRMR and NFI thresholds indicates acceptable model fit in the transcript’s checklist?
Key Points
- 1
Use outer loadings ≥ 0.70 as the default indicator reliability threshold in PLS-SEM.
- 2
For outer loadings between 0.40 and 0.70, retention depends on whether AVE and composite reliability are adequate.
- 3
Target Cronbach’s alpha ≥ 0.70 (or ≥ 0.60 for exploratory research) and treat values above 0.95 as potentially redundant.
- 4
Require AVE ≥ 0.50 for convergent validity and use either Fornell–Larcker or HTMT for discriminant validity.
- 5
Judge path significance with bootstrapped p-values (commonly p < 0.05) and interpret R² using 0.25/0.50/0.75 benchmarks.
- 6
Check predictive relevance with Q² > 0 and model fit with SRMR < 0.08 and NFI > 0.90.