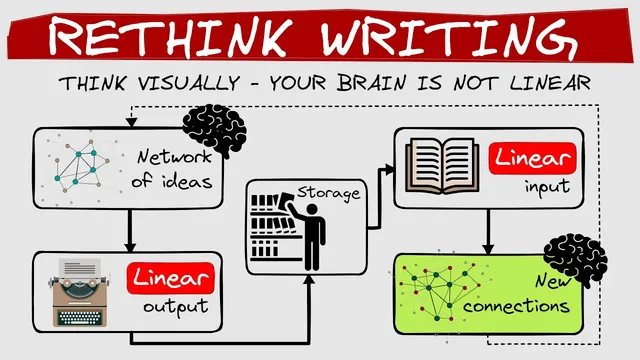
Rethink Writing: Think Visually, Your Brain is Not Linear
Based on Zsolt's Visual Personal Knowledge Management's video on YouTube. If you like this content, support the original creators by watching, liking and subscribing to their content.
Visual thinking is positioned as a more efficient primary tool than text-only reading because short-term memory can only hold about seven to nine concepts at once.
Briefing
Writing helps people think, but reading and writing are often treated as the main engines of understanding in personal knowledge management—an approach that can be inefficient when information is complex. The core claim is that visual thinking is a more effective primary tool for absorbing, organizing, and navigating ideas, because human short-term memory can only juggle roughly seven to nine concepts at once. When ideas are represented visually—through diagrams, concept maps, or mind maps—they act like a “tray,” letting people hold more information, see relationships instantly, and reduce mental overload.
That efficiency gap shows up in everyday work and education. In a workshop reviewing engineering documentation, the material contained lots of text but few well-structured diagrams. The argument traces the problem to schooling that lacks deep instruction in visual thinking, leaving many people to default to writing even when it’s the wrong tool. The comparison is blunt: text-heavy documentation is like using only butter knives to slice meat—technically possible, but poorly suited to the task. Likewise, carrying many items across a room without a tray leads to dropped items; trying to process dense text line-by-line leads to cognitive strain and errors.
The transcript contrasts visual “maps” with text “lists of directions.” A map provides an immediate overview of landmarks and routes, while a list forces step-by-step processing that is slower and more error-prone. This framing extends to technical documentation: when teams debate whether to model requirements with UML or list them in an Excel table, diagrams are presented as the clearer choice because they surface dependencies and connections at a glance. The same logic is applied to legal documents, which are described as notoriously text-heavy and difficult to parse. Modeling them visually—using process flows and concept maps, with text reserved for details—would make them more accessible and reduce reliance on expensive expert mediation.
The case for visual thinking also includes how people read. Watching an interview with an author changes comprehension by adding a mental image of the author’s personality and key ideas; reading afterward becomes more than decoding words. That mental imagery is treated as a form of visual thinking—an internal visualization that enriches understanding.
Finally, the transcript flips the common “writing is thinking” mantra. Writing can clarify and articulate ideas, but it often comes after a visual stage. In creating a book on Atomic Habits by James Clear, the process began with visual summaries of key concepts—described as illustrated post-it notes—to organize a coherent storyline before translating it into script and written summary. The practical takeaway is not anti-writing; it’s pro-modeling. If someone can’t visualize an idea quickly, the argument suggests they may not fully understand it yet. When diagrams are needed, creating one is framed as a fast test of clarity—if the diagram can’t be produced, the requirements may be fuzzy. The bottom line: writing is one tool for thought, but visual thinking provides the framework that makes understanding and organization more efficient.
Cornell Notes
The transcript argues that writing is often overvalued as the main tool for thinking in personal knowledge management. Because short-term memory can only hold about seven to nine concepts, visual representations act like a “tray,” letting people manage more ideas and see connections quickly. Maps and diagrams provide an instant overview that text lists and dense documents force people to process line-by-line, increasing cognitive load and error risk. The approach is illustrated through work documentation, technical requirements modeling (diagrams vs Excel tables), and book creation using visual summaries before writing. The message is not anti-writing: it’s a call to make visualization the primary step for clarity and understanding.
Why does the transcript claim writing is an inefficient primary method for understanding complex information?
How does the “map vs list of directions” analogy support the argument for visual thinking?
What examples are used to show where diagrams outperform text in real work?
How does the transcript connect reading comprehension to visualization beyond diagrams?
What does the transcript suggest about the order of thinking tools when creating content?
What practical test does the transcript propose for whether someone truly understands an idea?
Review Questions
- What cognitive limitation does the transcript cite to explain why text-only processing becomes inefficient, and how do visuals counter it?
- Compare the roles of diagrams and Excel tables in the transcript’s requirements-modeling example. What specific benefit does the diagram provide?
- In the book-creation example, why does the transcript treat visual summaries as a prerequisite to writing rather than a supplement?
Key Points
- 1
Visual thinking is positioned as a more efficient primary tool than text-only reading because short-term memory can only hold about seven to nine concepts at once.
- 2
Diagrams and concept maps reduce cognitive load by making dependencies and connections visible at a glance.
- 3
Text-heavy documentation often results from insufficient education in visual thinking, causing people to default to writing even when diagrams would work better.
- 4
Maps and visual notes outperform lists of directions by providing instant overview and lowering the chance of mental errors.
- 5
Technical and legal information becomes more accessible when modeled visually, with text used mainly for elaboration.
- 6
Writing is still useful for clarifying and articulating ideas, but the transcript recommends starting with visualization to distill the essence first.
- 7
Difficulty creating a diagram is treated as a signal that the underlying idea or requirements may not be fully understood yet.