Stepwise Interpretation of Moderation Results using #SmartPLS4
Based on Research With Fawad's video on YouTube. If you like this content, support the original creators by watching, liking and subscribing to their content.
Run corrected accelerated bootstrapping (recommended 5,000–10,000) and use the interaction term’s significance to decide whether moderation is supported.
Briefing
Moderation results in SmartPLS become much easier to interpret when the analysis is broken into a stepwise decision path: first confirm whether the interaction is significant, then determine whether it strengthens or weakens the main relationship, and finally use simple-slope output to see how the relationship changes across moderator levels. Using a sample model with collaborative culture (IV) predicting organizational performance (DV), moderated by role ambiguity and role conflict, the workflow starts with bootstrapping (recommended 5,000–10,000 cases using corrected accelerated bootstrap and one-tailed testing).
The bootstrapping output separates which moderators actually matter. Role conflict does not moderate the collaborative culture → organizational performance link: the interaction term is insignificant, so the null hypothesis for that moderation effect is not rejected. Role ambiguity, by contrast, shows a significant moderating interaction effect. That significance triggers the next stage—interpreting the direction of the moderation—because a significant interaction alone doesn’t tell whether the moderator amplifies or dampens the IV–DV relationship.
The interaction coefficient for role ambiguity is negative, meaning the moderator weakens the relationship between collaborative culture and organizational performance. From there, the analysis checks the sign of the underlying IV→DV relationship being moderated. In the example, the collaborative culture → organizational performance path coefficient is positive and significant. Combining these signs yields a clear interpretation: as role ambiguity increases, the positive effect of collaborative culture on organizational performance becomes less strong.
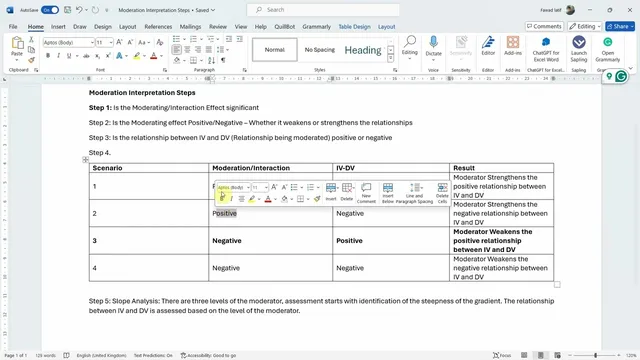
To make this logic reusable, the method lays out four sign-based scenarios for any moderation result: (1) positive interaction + positive IV→DV strengthens the relationship; (2) positive interaction + negative IV→DV strengthens the negative relationship; (3) negative interaction + positive IV→DV weakens the positive relationship; and (4) negative interaction + negative IV→DV weakens the negative relationship. In the case at hand, the analysis lands in scenario three.
Once the interaction is significant, the workflow moves to slope analysis (simple slopes) to visualize how the relationship changes at different moderator levels. In SmartPLS, this involves running the appropriate algorithm steps (calculate bootstrapping/PLS-SEM algorithm and then using simple slope analysis). The key question becomes which line is steeper across moderator levels. The slope plot shows three moderator levels; the red line (low role ambiguity) is steeper than the others. That means when role ambiguity is low, increasing collaborative culture produces a sharper rise in organizational performance. When role ambiguity is high (green line), the same increase in collaborative culture does not translate into as steep a gain in organizational performance.
Taken together, the stepwise approach converts moderation output into an interpretable story: role ambiguity significantly weakens the positive impact of collaborative culture on organizational performance, while role conflict shows no moderation effect in this model.
Cornell Notes
The moderation workflow in SmartPLS is organized into three decision steps: (1) test whether the interaction (moderating interaction effect) is significant, (2) interpret the interaction’s sign to determine whether the moderator strengthens or weakens the IV→DV relationship, and (3) confirm the sign of the IV→DV path to determine the practical meaning of the moderation. In the example model, role conflict’s interaction is insignificant, so it does not moderate collaborative culture’s effect on organizational performance. Role ambiguity’s interaction is significant and negative, and the IV→DV relationship is positive, placing the result in the “negative interaction + positive IV→DV” scenario—meaning higher role ambiguity weakens the positive effect. Simple-slope analysis then shows the mechanism: the relationship is steepest at low role ambiguity and flattens at higher role ambiguity.
How does the workflow decide whether a moderator effect is supported in SmartPLS moderation analysis?
What does a negative moderating interaction coefficient mean in this framework?
Why does the sign of the IV→DV path matter after the interaction is significant?
What are the four sign scenarios for moderation, and how do they translate into interpretation?
How does simple-slope analysis show the moderation effect across moderator levels?
Review Questions
- In the example model, why is role conflict treated differently from role ambiguity when interpreting moderation results?
- If the interaction effect were positive but the IV→DV path were negative, which of the four scenarios would apply and what would it mean substantively?
- When using simple-slope output, what does it mean if the line at low moderator level is steeper than the line at high moderator level?
Key Points
- 1
Run corrected accelerated bootstrapping (recommended 5,000–10,000) and use the interaction term’s significance to decide whether moderation is supported.
- 2
If the interaction effect is insignificant, do not interpret the moderator further; the null hypothesis for moderation remains not rejected.
- 3
Interpret the moderation direction using the sign of the interaction coefficient: negative weakens the IV→DV relationship, positive strengthens it.
- 4
Combine the interaction sign with the sign of the IV→DV path to select one of four scenarios that clarifies whether a positive or negative relationship is strengthened or weakened.
- 5
Use simple-slope analysis to visualize moderation by comparing line steepness across moderator levels.
- 6
In the example, role conflict shows no moderation, while role ambiguity significantly weakens the positive effect of collaborative culture on organizational performance.