Systematic Literature Review: Data Extraction and Synthesis (S4.2)
Based on Research With Fawad's video on YouTube. If you like this content, support the original creators by watching, liking and subscribing to their content.
Use a predefined data extraction form or spreadsheet to standardize what gets recorded across all included studies.
Briefing
Systematic literature reviews hinge on a disciplined two-step workflow after studies are selected: extract the right data in a consistent format, then synthesize results across studies to answer the review’s research questions. Data extraction turns raw study details into an organized evidence set—making it possible to compare findings, assess patterns, and ultimately draw conclusions that are traceable back to individual papers.
Extraction starts with a predefined data extraction form or spreadsheet to keep information consistent across included studies. Common fields include author, publication year, and journal, along with study objectives or research questions. Methodological details typically captured include study design, sample size, and data collection techniques. Reviews also extract key variables and how they were measured, plus each study’s main findings and conclusions. Limitations noted by the original authors are recorded as well, since they later affect how strong the evidence is considered. Depending on the review’s goals, additional columns may capture the theoretical framework used to explain relationships between variables, the study context, and how that context informs understanding of the review topic.
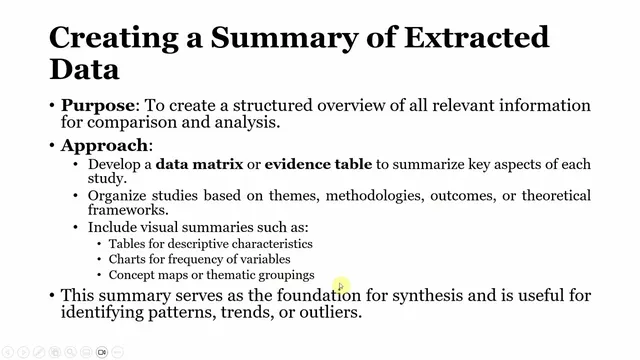
To support this work, extraction can be managed in Excel or Google Sheets, or through systematic review software such as Covidence and EPI Reviewer. Once extraction is complete, the next move is to create a structured summary of the extracted data. This often takes the form of an evidence table or data matrix that organizes studies by themes, methodologies, outcomes, or theoretical frameworks. Visual summaries—descriptive characteristic tables, frequency charts, or concept maps—help surface patterns, trends, and outliers. This structured overview becomes the foundation for synthesis and for identifying where evidence is consistent, mixed, or missing.
Synthesis integrates findings from multiple studies to produce broader conclusions. For example, in a review of corporate social responsibility (CSR) and organizational performance, extracted results might show some studies reporting no relationship, others reporting positive effects, and still others reporting negative effects. When results are mixed, the synthesis can conclude that evidence is inconclusive and use that inconsistency to highlight research gaps.
Synthesis can be qualitative or quantitative. Qualitative synthesis includes thematic analysis or narrative synthesis, particularly suited to conceptual or exploratory reviews, while quantitative synthesis uses meta-analysis when studies report comparable numerical data. Regardless of approach, synthesis typically involves identifying common themes or categories, comparing and contrasting outcomes to find consistencies and discrepancies, and assessing the strength of evidence while accounting for study quality. Evidence strength can depend on factors such as whether studies use secondary data with measurable impact (e.g., CSR investment effects) or whether proposed measurement tools have established psychometric properties like reliability and validity.
Finally, synthesis decisions must be transparent and systematic. That means documenting each step, reporting potential biases, heterogeneity, and limitations in the synthesis process, and being explicit about how implications connect back to the review’s research questions. The extracted spreadsheet can also directly feed tables and figures for reporting—such as tables of study characteristics, measures used, item counts, questionnaire administration methods, and analysis types—so future researchers can select appropriate tools and understand how conclusions were built.
Cornell Notes
After selecting studies for a systematic literature review, researchers must extract and synthesize data in a structured, repeatable way. Data extraction relies on a predefined form or spreadsheet (often Excel/Google Sheets or tools like Covidence and EPI Reviewer) to capture consistent fields such as author, year, journal, objectives/research questions, design, sample size, data collection methods, variables and measurement, findings, conclusions, and limitations. The extracted information is then organized into evidence tables or data matrices that group studies by themes, methods, outcomes, or theoretical frameworks, often supported by charts or concept maps. Synthesis integrates results across studies to draw broader conclusions—using qualitative thematic/narrative methods for conceptual work or meta-analysis when numerical data are comparable. Throughout, synthesis must be transparent about decisions, biases, heterogeneity, and evidence strength.
What information should be captured during data extraction, and why does the choice of fields matter?
How does using a predefined extraction form or spreadsheet improve the quality of a systematic review?
What is an evidence table or data matrix, and how does it support synthesis?
When should a review use qualitative synthesis versus meta-analysis?
How do researchers assess the strength of evidence during synthesis?
What does transparency in synthesis require?
Review Questions
- What core fields would you include in a data extraction spreadsheet to ensure your synthesis can answer your review’s research questions?
- How would you decide whether to use thematic/narrative synthesis or meta-analysis for a set of included studies?
- What kinds of transparency and documentation should be maintained when synthesizing mixed or conflicting study results?
Key Points
- 1
Use a predefined data extraction form or spreadsheet to standardize what gets recorded across all included studies.
- 2
Capture bibliographic details (author, publication year, journal) alongside objectives/research questions and methodological information (design, sample size, data collection).
- 3
Extract variables and measurement details, plus each study’s findings, conclusions, and limitations to support later evidence grading.
- 4
Organize extracted data into an evidence table or data matrix grouped by themes, methods, outcomes, or theoretical frameworks, using charts or concept maps when helpful.
- 5
Choose qualitative synthesis (thematic/narrative) for conceptual or exploratory aims and meta-analysis only when studies report comparable numerical data.
- 6
Assess evidence strength using study quality and concrete indicators such as direct impact measures or established psychometric properties (reliability and validity).
- 7
Document synthesis steps and report biases, heterogeneity, and limitations to maintain transparency and traceability of conclusions.