Understanding Independent Sample T Test and One Way ANOVA in SPSS
Based on Research With Fawad's video on YouTube. If you like this content, support the original creators by watching, liking and subscribing to their content.
Run Levene’s test first for both independent-samples t tests and one-way ANOVA; it determines which variance assumption row/test to use.
Briefing
An independent-samples t test in SPSS is used to check whether two groups differ on a continuous outcome, and the workflow hinges on Levene’s test for equality of variances—because that decision determines which p value and which row of results to report. In the example, “vision” is the dependent variable, and gender (male vs. female) is the grouping variable. After running Analyze → Compare Means → Independent Samples T Test, the output first requires checking Levene’s test: when the Levene p value is greater than 0.05, equal variances are assumed and the “equal variances assumed” row is used for the t statistic and two-sided p value. Here, Levene’s test is above 0.05, so equal variances are assumed. The group means show males scoring higher (mean 5.08, SD 1.35) than females (mean 4.73, SD 1.43). The two-sided p value for the t test is 0.082 with t = 1.744, which is treated as a partially supported (i.e., not fully significant at the 0.05 level) difference. Effect size is also reported as small (reported as 0.26 in the transcript), reinforcing that any observed gap is modest.
The transcript then shifts from two-group comparisons to one-way ANOVA for situations with three or more groups, using the same logic but expanding it beyond t tests. The key distinction: independent-samples t tests handle two groups, while one-way ANOVA tests whether mean differences exist across three or more groups. Before running ANOVA, several assumptions are emphasized: the dependent variable should be continuous (interval/ratio), roughly normally distributed, without problematic outliers, and—critically—homogeneity of variance. Levene’s test again drives the choice of ANOVA variant and post hoc procedure. When Levene’s test is not significant (p > 0.05), standard ANOVA is used and post hoc comparisons can rely on equal-variance methods such as Tukey. When Levene’s test is significant (p < 0.05), equal variances are not assumed; the transcript recommends Welch’s ANOVA and post hoc tests designed for unequal variances, such as Games-Howell.
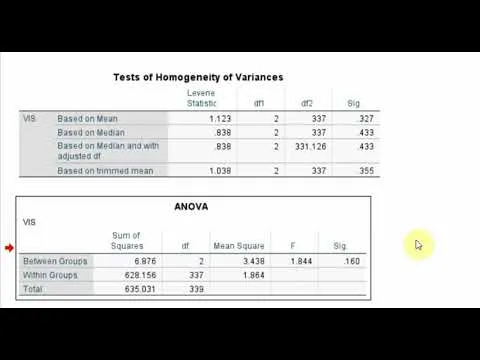
A worked example uses “vision” across three job ranks (junior, middle, senior). Descriptives show means rising with rank (junior 4.84, middle 5.05, senior 5.31; overall mean 5.03). Levene’s test is insignificant, so homogeneity holds, and the ANOVA main effect is checked. The between-group p value is 0.160 (F = 1.844), so no statistically significant differences are found; that means post hoc comparisons are unnecessary. The transcript then demonstrates a second example using a different dependent variable (“development initiatives”), where Levene’s test is significant and Welch’s ANOVA indicates a significant main effect (Welch statistic 4.76). Because unequal variances are involved and the overall test is significant, post hoc comparisons proceed with Games-Howell. In the reported pairwise results, junior differs significantly from senior, while junior vs. middle is not significant; middle vs. senior is also not significant. Finally, the transcript provides practical guidance for writing up results: report the correct test (t test vs. Welch ANOVA), include the relevant statistics (t, F or Welch, p values), and summarize only the significant pairwise comparisons rather than every comparison from SPSS output.
Cornell Notes
The independent-samples t test in SPSS compares two group means on a continuous outcome, but the “equal variances assumed” vs. “not assumed” decision comes from Levene’s test. In the gender example, Levene’s p value is above 0.05, so equal variances are assumed; males have a higher mean vision score (5.08) than females (4.73), yet the two-sided p value is 0.082 with t = 1.744, described as only partially supported at the 0.05 level. For three or more groups, one-way ANOVA replaces multiple t tests, again using Levene’s test to decide between standard ANOVA (Tukey post hoc) and Welch’s ANOVA (Games-Howell post hoc). In the job-rank “vision” example, ANOVA is not significant (p = 0.160), so post hoc tests are skipped; for “development initiatives,” Welch’s ANOVA is significant (Welch = 4.76), and Games-Howell identifies a significant junior–senior difference.
Why does Levene’s test matter before interpreting an independent-samples t test in SPSS?
How should the gender-group t test results be reported when the p value is 0.082?
What is the core difference between using independent-samples t tests and one-way ANOVA?
When does one-way ANOVA require post hoc comparisons, and which post hoc test should be chosen?
How do the job-rank examples illustrate the decision to run (or skip) post hoc tests?
Review Questions
- In SPSS independent-samples t test output, which row do you use when Levene’s test p value is 0.07, and what does that imply about variances?
- For one-way ANOVA with three groups, what two conditions must be met before post hoc comparisons are necessary?
- If Levene’s test is significant, which ANOVA variant and which post hoc test are recommended in the transcript?
Key Points
- 1
Run Levene’s test first for both independent-samples t tests and one-way ANOVA; it determines which variance assumption row/test to use.
- 2
For independent-samples t tests, use the two-sided p value when the hypothesis is nondirectional (no prior expectation that one group is higher).
- 3
Report group means and standard deviations alongside the test statistic (t) and p value; interpret p values relative to 0.05.
- 4
For one-way ANOVA, check assumptions (continuous outcome, near-normal distribution, no problematic outliers, and variance homogeneity).
- 5
If Levene’s test is not significant and the ANOVA main effect is not significant, skip post hoc comparisons.
- 6
If Levene’s test is significant, use Welch’s ANOVA and Games-Howell post hoc tests, then report only the significant pairwise differences.
- 7
In write-ups, summarize significant comparisons (e.g., junior vs. senior) and avoid listing every nonsignificant pairwise result.