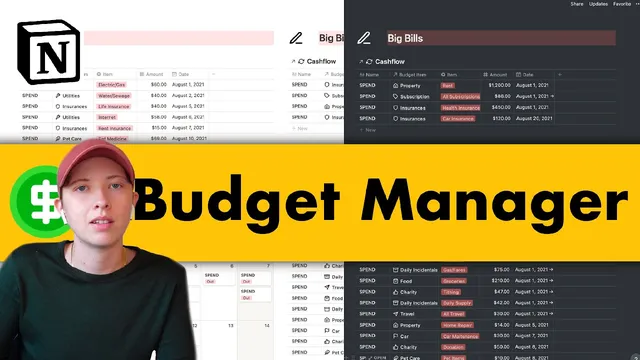
Notion for Finance: A Monthly Cashflow Manager w/ Budget Tracker
Based on Red Gregory's video on YouTube. If you like this content, support the original creators by watching, liking and subscribing to their content.
The system is built as a connected database chain: budget categories → cash flow transactions → month cards → aggregated balance and savings.
Briefing
A zero-based monthly cashflow budget manager built in Notion automatically rolls income and spending into a month-by-month system, then allocates the leftover balance into customizable savings goals—so each month ends at a savings-ready “zero.” The setup hinges on connected databases: a cash flow ledger records every transaction, a budget table defines monthly categories, a months database ties everything to a specific month, and a balance/savings layer aggregates results and computes how much gets assigned to each savings goal.
The budget table acts as the category backbone. It lists broad budget items such as property insurance, utilities, and other recurring categories, each with a monthly budget amount. A roll-up pulls totals from the cash flow database to show how much has actually been spent per category for the month, then uses a formula to label each category as over, under, or on budget based on the monthly average. New categories can be added quickly, including currency selection and optional icons (the template suggests using Super.so icons for minimal visuals).
Cash flow is the master transaction database. It includes two core views—earnings (money in) and spending (money out)—separated using filters on an “i/o” select property and name patterns (e.g., “contains income” or “contains spend”). Each cash flow entry links back to the budget table via a relation property, so a transaction like rent or groceries can be tied to its budget category. Transactions can use either single dates or date ranges; the template uses a formula to omit range-based entries from the front-page calendar to avoid clutter, only showing items where the date span is effectively non-zero.
The months database is the orchestration layer. Each month card (e.g., “August 2021”) connects to cash flow through separate relations for spending and earnings, then rolls up totals for total earned and total spent. A “gross balance” formula calculates the difference between earnings and spending for that month. From there, the system allocates the gross balance into multiple savings goals using fixed percentages (the example uses three goals: 50%, 30%, and 20%), ensuring the monthly balance is effectively fully assigned rather than left unplanned.
Inside each month page, embedded and filtered views let users add transactions without manually re-linking everything. Windows for income and tagged spending categories (like small bills, big bills, daily living, and debt) filter cash flow entries to the current month card. A template mechanism replaces hardcoded month filters with the month card’s name, so creating a new month (like “September 2021”) loads the correct structure with empty windows ready for data.
For analysis, the cash flow database also includes board-style “average spending” and “average earning” views that behave like pivot tables: they group by item tags and compute aggregates such as sum, average, median, minimum, maximum, and range, with optional date filters. Linked database views allow these summaries to appear elsewhere without altering the master data.
Overall, the system’s value is operational: it turns budgeting into a repeatable monthly workflow where categories, transactions, roll-ups, and savings allocations stay connected automatically, producing a consistent month-end outcome and a clear trail from ledger entries to savings totals.
Cornell Notes
The Notion budget manager uses connected databases to run a zero-based monthly cashflow workflow. A cash flow ledger records earnings and spending (with single dates or date ranges), while a budget table defines monthly category targets and roll-ups track how each category is trending versus its budget. A months database ties transactions to a specific month, rolls up total earned and total spent, computes gross balance, then allocates the leftover into multiple savings goals using percentage splits (so the month ends fully allocated). This structure also supports month templates that auto-wire filters to the month card’s name, plus pivot-like board views for average spending/earning by category and tag. The result is a repeatable system that turns transactions into month-end savings planning automatically.
How does the template enforce a zero-based budget at month end?
What role does the budget table play compared with the cash flow ledger?
Why does the cash flow database support both single dates and date ranges?
How does the months database automatically connect transactions to the correct month card?
What kinds of analysis views are included, and how do they work?
How are savings totals aggregated across months?
Review Questions
- If a category shows “over budget” in the budget table, which underlying data path is responsible for that status—budget targets, cash flow transactions, or the roll-up formula?
- How does the template prevent date-range transactions from cluttering the front-page calendar while still keeping them in monthly totals?
- When creating a new month card, what mechanism ensures the month-specific filters update from “August 2021” to the new month name?
Key Points
- 1
The system is built as a connected database chain: budget categories → cash flow transactions → month cards → aggregated balance and savings.
- 2
Zero-based month end is achieved by computing gross balance (earnings minus spending) and allocating it fully into multiple savings goals using percentage splits.
- 3
Budget roll-ups pull actual spending totals from the cash flow ledger back into each budget category, then apply an over/under/on-budget formula using monthly averages.
- 4
Cash flow entries can use single dates or date ranges; a formula suppresses range entries from the front-page calendar to reduce clutter.
- 5
Month pages are generated from a template that replaces hardcoded month filters with the month card’s name, so new months load correctly with empty windows.
- 6
Pivot-like board views provide category-level analytics (sum/average/median/min/max/range) with optional date filtering.
- 7
Linked database views let summaries appear on other pages without changing the underlying master database data.