Notion for Habits: How To Build A Habit Tracker In 2022 (free template)
Based on Red Gregory's video on YouTube. If you like this content, support the original creators by watching, liking and subscribing to their content.
Create a daily “my habits” calendar database with checkbox properties for each habit and a date property that anchors entries to the calendar.
Briefing
A habit tracker in Notion can be upgraded from simple checkboxes into an analytics dashboard by linking a “daily habits” calendar to a separate “analytics” database. The key move is building an analytical table that uses relations and formulas to calculate completion rates, then visualizing those rates as progress bars or rings—so daily effort turns into measurable trends.
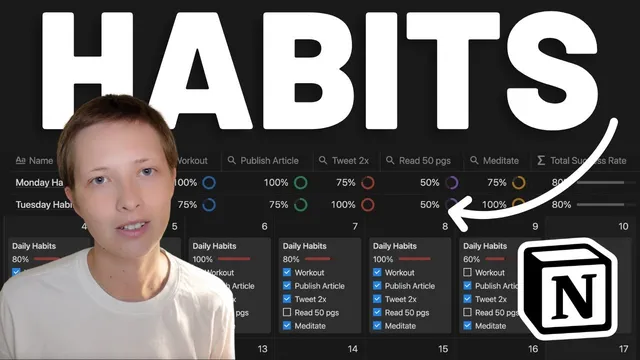
The workflow starts with a calendar-style database called “my habits,” where each day contains checkbox properties for multiple habits (five in the example) plus a date property that anchors the entry to the calendar. To turn that raw activity into metrics, a second database named “analytics” is created as an analytical table. A relation property connects “analytics” back to “my habits,” with the relation configured to show the linked daily pages and no limit on related entries. Once the connection is in place, every daily page automatically links to the corresponding analytics page.
To compute daily completion, a formula property in the “my habits” pages converts each checkbox into a numeric value using a two-number function (0 for unchecked, 1 for checked). Those five values are summed and divided by the total number of habits to produce a percentage. The result is rounded down using a floor-based approach (scaling by 1,000, flooring, then dividing by 1,000) to keep the metric stable. That percentage is then formatted as a progress bar (with configurable color and optional percentage display), and the formula is surfaced in the calendar view so completion visibly rises and falls as checkboxes are toggled.
Next, the analytics database is expanded with roll-ups that measure completion by individual habit across all linked days. Each roll-up uses the relation to pull in daily checkbox data for one habit (e.g., “meditate,” “publish article,” “Read 50 pages,” “tweet 2 times,” “workout”) and converts “percent checked” into a progress ring with distinct colors per habit. A final formula aggregates those roll-up values into an overall “success rate” across the set of habits, again using floor-based rounding and formatting it as a bar or ring.
For deeper analysis, the analytics table is duplicated into views like “total” and “weekdays.” The “weekdays” view filters out the “habit completion rate” page and creates seven pages—one for each day of the week. Each weekday page is manually linked to the appropriate dates in the calendar (e.g., Thursday entries), allowing the roll-ups to update based on which days are connected. The same structure can be extended to other time slices like quarters or additional months.
Finally, the system can automate habit completion when the underlying data lives elsewhere. An “article database” example is built with a relation back to habits via a “published” link. Instead of manually checking “publish article 2 times,” the tracker converts the roll-up count of related articles into a formulaic checkbox, so the habit’s completion updates automatically when new article records are marked as due on a given date. The result is a flexible habit tracker that combines manual checkboxes, relational analytics, and automated progress updates—without losing the calendar-style simplicity people want for daily routines.
Cornell Notes
The setup uses two Notion databases: a daily “my habits” calendar with checkbox properties, and an “analytics” table that links back to those daily entries. Relations let each analytics page pull in all related daily pages, while formulas convert checkboxes into numeric values to calculate daily completion percentages. Roll-ups then summarize completion by each individual habit across linked days, and another formula aggregates those roll-ups into an overall success rate. Duplicating the analytics view into “weekdays” (Monday–Sunday pages) enables day-of-week performance analysis, and connecting external databases (like an “article database”) can automate habit checkboxes based on related record counts.
How does the tracker turn checkbox habits into a measurable daily completion rate?
What role does the “analytics” database play, and how is it connected to daily habit pages?
How are individual habits summarized across days without manually calculating totals?
How does the system compute an overall success rate from multiple roll-ups?
How can the tracker analyze performance by day of the week?
How can habit completion be automated using data from another database?
Review Questions
- If you wanted to add a sixth habit to the tracker, what parts of the formulas and roll-ups would need adjustment (and why)?
- What configuration choices in the relation and filtering steps ensure that each daily page automatically connects to the correct analytics page?
- How would you modify the weekday analysis approach to analyze performance by month or quarter instead of Monday–Sunday?
Key Points
- 1
Create a daily “my habits” calendar database with checkbox properties for each habit and a date property that anchors entries to the calendar.
- 2
Build a separate “analytics” database and connect it to daily pages using a relation so each day’s analytics page can pull in all related habit entries.
- 3
Use formulas to convert checkboxes into 0/1 values, sum them, divide by the number of habits, and round down for a stable daily completion percentage.
- 4
Use roll-ups in “analytics” to compute per-habit completion across days (via percent checked) and display results as progress rings with distinct colors.
- 5
Add an overall success-rate formula that averages the per-habit roll-ups and formats it as a progress bar or ring.
- 6
Duplicate analytics into filtered views like “weekdays” and create Monday–Sunday pages linked to the corresponding calendar dates for day-of-week insights.
- 7
Automate habit completion by linking external data (like an “article database”) and turning roll-up counts into formulaic checkboxes (e.g., equals 2).