Notion Task Manager and Productivity Tracker (Free Template)
Based on Red Gregory's video on YouTube. If you like this content, support the original creators by watching, liking and subscribing to their content.
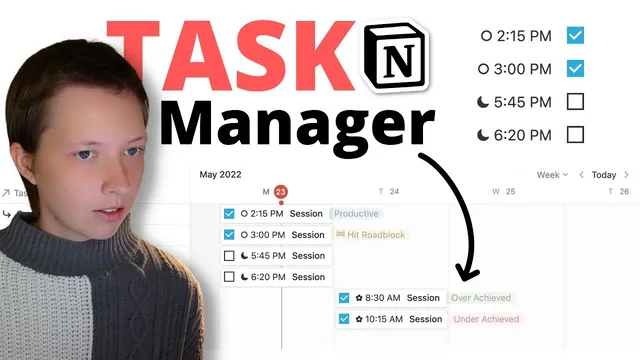
Create two linked databases: “My Tasks” for task metadata and “Timetable” for scheduled work sessions.
Briefing
A free Notion setup turns task planning into a connected system: tasks feed a weekly timetable of work sessions, and those sessions roll up into hours tracked per task. The core payoff is that every scheduled work block can be tied to a specific task, automatically inherits the task’s deadline, calculates time spent, and then updates task-level totals—so productivity tracking happens as a byproduct of scheduling.
The build starts with two linked databases. The first is a “My Tasks” calendar-style database with key properties: a deadline date, a status select (Not started, Idea, In progress, Completed), a text description, and a formula that derives the weekday from the deadline. A simple “new task” template adds a consistent icon to make task creation faster. Status is also used to create a pipeline board view that groups tasks by stage, while an advanced filter prevents the “Completed” column from growing endlessly by hiding items completed more than a week ago. Those older completed tasks are redirected into an archive-style table grouped by deadline week.
The second database is a “Timetable” built as a timeline view. Each timeline card represents a work session and includes a session name, a checkbox for done, and a “result” select (underachieve, roadblock, productive). A relation property links each session back to a task in “My Tasks.” From that relation, a rollup pulls in the task’s deadline so the session can be scheduled with the right date range. The timetable also calculates session duration: a formula computes hours from the session start and end times (using a minutes-between calculation, then converting to hours and rounding). To support planning, additional formulas label sessions as belonging to “this week” or “next week,” and another formula categorizes the session start time into morning/afternoon/night using hour thresholds and emojis.
To make the system usable day-to-day, multiple filtered views are created from the same timetable: “this week,” “next week,” and “today,” plus a monthly “index” list that groups sessions by month (or by task) and can show totals. The “index” view supports deeper tracking by grouping and sorting sessions, while task pages gain a rollup called “total hours” that sums the hours from all related sessions. That creates a feedback loop: schedule sessions → mark done → automatically accumulate hours on the task.
Finally, everything is assembled into a dashboard homepage with linked views for quick actions: schedule sessions, view today’s timeline, open the task pipeline, and browse the session index. The dashboard also includes a linked tasks table for brainstorming ideas filtered to status “Idea,” letting new ideas become tasks that can later be scheduled into the timetable. The result is a single Notion workspace where planning, execution, and time tracking stay connected through relations, rollups, and carefully designed filters.
Cornell Notes
The setup builds a two-database Notion system where tasks drive a weekly timetable of work sessions. “My Tasks” stores deadline, status, and description, then feeds a pipeline view that hides completed items older than a week into an archive. “Timetable” stores session start/end times, a done checkbox, and a result; each session is related to a task, rollups the task deadline, and calculates hours worked from the time range. Filtered views (“this week,” “next week,” “today”) and a monthly index make scheduling and review fast, while a task-page rollup (“total hours”) sums hours from all linked sessions. This matters because time tracking becomes automatic once sessions are scheduled and marked done.
How does the system prevent the task pipeline from becoming cluttered as tasks accumulate?
What makes each timetable card a “work session” tied to a specific task?
How are hours worked calculated for a session, and when does the formula run?
How do the “this week” and “next week” views decide which sessions belong where?
What role do rollups play in turning session data back into task-level metrics?
How does the dashboard enable quick scheduling and idea capture without leaving the homepage?
Review Questions
- What specific filter logic keeps the “Completed” column from growing indefinitely in the tasks pipeline?
- Describe the chain of data flow from a task deadline to a timetable session (relation + rollup).
- How does the “hours” formula ensure accurate time tracking and avoid counting sessions that aren’t marked done?
Key Points
- 1
Create two linked databases: “My Tasks” for task metadata and “Timetable” for scheduled work sessions.
- 2
Use a status pipeline view for tasks, then apply an advanced filter so completed tasks older than a week move out of the main pipeline.
- 3
Connect each timetable session to a task via a relation, then roll up the task deadline into the session for consistent scheduling.
- 4
Calculate session duration with a formula that runs only when the done checkbox is checked, converting minutes between start/end into rounded hours.
- 5
Add filtered timetable views for “this week,” “next week,” and “today” using a week-label formula based on ISO-style week numbers (Monday–Sunday).
- 6
Use a task-page rollup (“total hours”) to sum hours from all related sessions, turning scheduling into automatic reporting.
- 7
Assemble everything into a dashboard using linked views so sessions and ideas can be added quickly from one homepage.