Notion Tips: Simple Budget Planning
Based on Red Gregory's video on YouTube. If you like this content, support the original creators by watching, liking and subscribing to their content.
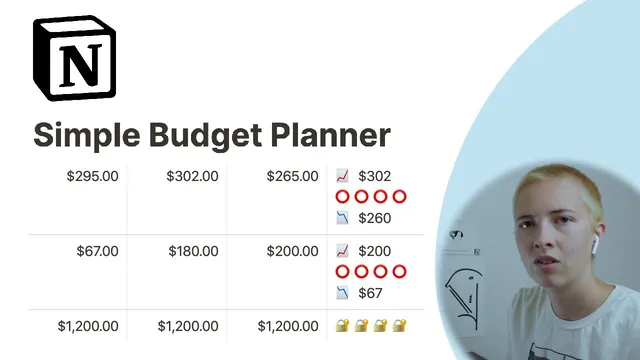
The planner averages spending across each four-month block and compares it to a monthly budget target to generate over/under signals.
Briefing
A simple Notion budget planner can flag whether spending runs over or under a monthly target by using database formulas—then summarize the result across four-month blocks and the full year. The system is built around a monthly budget number, category “names” (like utilities, groceries, entertainment, and rent), and month-by-month properties for the year. At the end of each four-month block, the planner averages the four monthly totals and compares that average to the monthly budget. If the average is higher than the target, it returns a red “over budget” indicator; if it’s lower, it returns a green “under budget” indicator.
The formulas go beyond a simple over/under check by also surfacing the extremes within each four-month block. For each block, the planner calculates the maximum monthly value (the most spent in any month) and the minimum monthly value (the least spent). These max/min results are displayed alongside the over/under emoji indicators, with the max paired to an upward graph emoji and the min paired to a downward graph emoji. That gives a quick read not only on whether the block stayed within budget, but also how volatile spending was inside the block.
A key refinement is handling fixed expenses separately. The planner includes a “select” property that can mark an expense as fixed. When the select value is fixed, the over/under formulas exclude those fixed items from the average-based comparisons, so rent-like costs don’t distort the “variable spending” signal. In practice, the logic uses conditional checks: when the select property is empty (variable items), it compares the average of the relevant four months to the monthly budget; when select equals fixed, it returns a lock emoji (and otherwise leaves the field blank).
For the yearly verdict, the planner scales the monthly budget by 12 and compares it to the summed totals of the three four-month blocks (part 1, part 2, part 3). If the scaled budget is greater than the combined spending, the planner marks the year as “in budget” with rainbow emojis; if it’s less, it marks “over budget” with sad-face emojis; otherwise it leaves the result blank. The same structure is repeated across all four-month blocks (January–April, May–August, September–December), with hidden properties used to store intermediate totals for the yearly calculation.
The workflow also supports deeper analysis. Instead of only relying on the over/under indicators, the planner can show sums for an entire month, and it can be extended to compute other statistics like average, median, or max. It can also be organized using database views—for example, creating a view that shows only January–April and then duplicating the approach for later blocks—so the same formula logic can be filtered into cleaner, part-specific dashboards. Finally, the transcript notes that while spreadsheets can be easier for complex budgeting, Notion’s database formulas (including max/min/average functions) make this kind of structured tracking workable when the goal is a lightweight planner with instant feedback.
Cornell Notes
The budget system in Notion uses database properties and formulas to compare spending against a monthly target. Each expense category has monthly values, and the planner groups months into three four-month blocks (Jan–Apr, May–Aug, Sep–Dec). For variable items (where the “select” property is empty), it averages the four months in a block and returns red “over budget” or green “under budget” emojis based on whether that average is greater or less than the monthly budget. It also computes max and min within each block to show the highest and lowest monthly spending. Fixed expenses (select = fixed) are handled separately with a lock emoji so they don’t skew the over/under comparisons. A yearly check compares monthly budget × 12 to the sum of the three block totals.
How does the planner decide whether a four-month block is over or under the monthly budget?
What role do max and min functions play in the budget dashboard?
How are fixed expenses prevented from distorting the over/under results?
How does the planner compute the yearly in-budget vs over-budget status?
What additional analysis options does the planner suggest beyond over/under emojis?
Review Questions
- If prop select is empty, what exact comparison does the planner make to decide over vs under budget for a four-month block?
- Why does the planner multiply prop monthly budget by 12 for the yearly check, and what does it compare that number against?
- How do max and min help interpret spending behavior even when the block is classified as over or under budget?
Key Points
- 1
The planner averages spending across each four-month block and compares it to a monthly budget target to generate over/under signals.
- 2
Red and green emoji outputs provide a quick visual check for whether variable spending stays within the monthly budget.
- 3
Max and min calculations identify the highest and lowest monthly spending within each four-month block, adding context to the over/under result.
- 4
A “select” property distinguishes fixed expenses so they can be excluded from average-based budget comparisons and marked with a lock emoji instead.
- 5
The yearly verdict compares monthly budget × 12 against the summed totals of the three four-month blocks, returning in-budget or over-budget emoji indicators.
- 6
Hidden properties store intermediate block totals to support the yearly calculation without cluttering the main layout.
- 7
Database views can filter to specific month ranges (e.g., January–April) to make block-by-block review easier.