Thinking with your Zettelkasten 🧠 an intro to Obsidian’s local graph view
Based on morganeua's video on YouTube. If you like this content, support the original creators by watching, liking and subscribing to their content.
Local graph view turns a single note into a mini mind map, making it easier to generate new ideas from clusters of related notes rather than linear browsing.
Briefing
Local graph view in Obsidian turns a growing slip box into a usable “mind map,” letting ideas cross-pollinate so new research angles emerge—especially when inspiration comes from the connections (and missing connections) between notes.
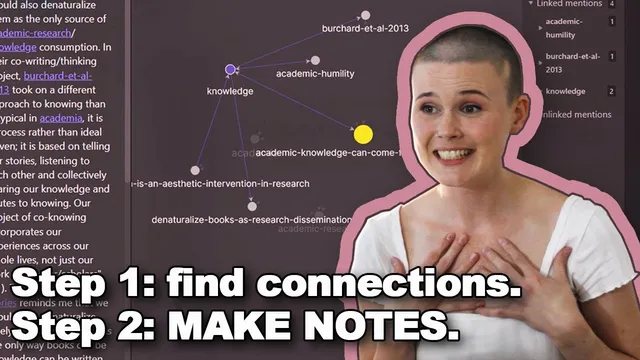
The workflow starts with a core distinction in the slip box method: documentation (note-taking) stores what’s learned, while creation (note-making) generates new thinking by linking. Morgan’s approach treats note-making as an iterative linking session. Instead of relying on the default alphabetical list of notes—which is “linear” and hard to navigate—she uses Obsidian’s local graph view for a single note to see a compact network of related ideas. The graph places the selected note at the center and shows one-link-away neighbors as nodes connected by lines, effectively creating a mini mind map that can spark new combinations.
A typical session begins by identifying a theme that’s already appearing across notes. For example, repeated references to “failure” eventually become a dedicated note. That note initially functions as a hub, but the backlinks list is still hard to interpret because it doesn’t reveal relationships among the surrounding ideas. Local graph view fixes that by showing the immediate neighborhood of the “failure” note, and then—crucially—by enabling “neighbor links” in the graph settings. With neighbor links turned on, the graph reveals connections among the neighboring nodes, not just links to the central idea. This makes it possible to spot gaps and opportunities: some notes about failure are connected to failure, but not connected to each other in ways that would make sense for future writing.
From there, the linking happens in two modes. First, she adds missing links between existing notes when the graph reveals that two relevant ideas were created at different times and never connected. Second—and more creatively—she uses the graph to generate new ideas by combining concepts that weren’t previously linked. A concrete example starts with a note called “you can’t cheat at juggling,” which initially sits alone in the failure neighborhood. She increases link depth to explore, then drills into that juggling note while keeping the graph’s filter context consistent. A quote attributed to Penn Jillette about learning and success conditions leads her to connect juggling’s clear “conditions for success” to life skills, including a note on “fear of failure.”
That chain expands further: fear of failure links to perfectionism, which links to procrastination and “never living out your dreams.” The result is a reframing of failure—from something to fear into something to respect because it’s part of how goals are achieved. She then creates a new note about the idea that improving at juggling requires frequent failure, and uses the updated local graph to guide the next connections. She also adds a new intersection note connecting “you can’t cheat at juggling” and “fear of failure,” and then creates additional supporting notes such as “failure teaches.”
When a note has too few connections to function as a brainstorming hub, she adjusts link depth (e.g., from one to two) to enlarge the local neighborhood and increase the chance of accidental, useful links. When a note has enough momentum, she warns that overly complex maps stop being inspirational; at that point, she switches to exploring smaller subgraphs from connected notes.
By the end, the graph view is positioned as a practical antidote to overwhelm: it makes idea generation feel less scary by turning a complex dissertation landscape into navigable clusters of related notes. The method also includes “placeholder” links—creating references to notes that don’t exist yet so they appear in the graph as dark nodes, ready to be turned into real notes later.
Cornell Notes
Local graph view in Obsidian helps turn a slip box into an idea engine. By centering a note and viewing its one-link neighborhood as a mini mind map, a user can see not only what relates to a theme but also how neighboring ideas connect when “neighbor links” are enabled. Morgan’s note-making process is iterative: she either adds missing links between existing notes or creates new intersection notes when two ideas combine into something new. Link depth acts as a dial—too few connections means increasing depth; too much complexity means drilling into smaller subgraphs. The payoff is faster, less overwhelming creativity for research writing because inspiration comes from visible networks rather than linear note lists.
How does local graph view change note-making compared with a linear list of notes?
What does “neighbor links” add to a one-link-deep graph?
What are the two main ways connections get formed during a note-making session?
How did “you can’t cheat at juggling” become a gateway into the “failure” theme?
What does Morgan do when a note has too few connections to inspire new ideas?
How does Morgan handle notes that become too complex to use as a brainstorming map?
Review Questions
- When should link depth be increased versus when should the workflow switch to a smaller subgraph?
- Describe how “neighbor links” changes what you can infer from a local graph view.
- Give an example of how Morgan uses an existing note as a gateway to create an intersection note. What triggered the new note?
Key Points
- 1
Local graph view turns a single note into a mini mind map, making it easier to generate new ideas from clusters of related notes rather than linear browsing.
- 2
Enabling “neighbor links” reveals connections among neighboring ideas, not just links to the central note—making gaps and opportunities easier to spot.
- 3
Note-making works best as an iterative loop: add missing links between existing notes, then create new intersection notes when combinations spark new thinking.
- 4
Link depth is a control knob: increase it when a note has too few connections to brainstorm, and drill into smaller subgraphs when maps become too complex.
- 5
Placeholder links can reference notes that don’t exist yet, allowing the graph to show future structure before the actual note is written.
- 6
A slip box’s value for research comes from using visible networks to reduce overwhelm and turn idea generation into a navigable process.