How To Build A Progress Bar In Notion: Habit Tracker (Part 1)
Based on Red Gregory's video on YouTube. If you like this content, support the original creators by watching, liking and subscribing to their content.
Count checked habits by summing `toNumber()` conversions of each checkbox property, then divide by the total number of habits (11 in the example).
Briefing
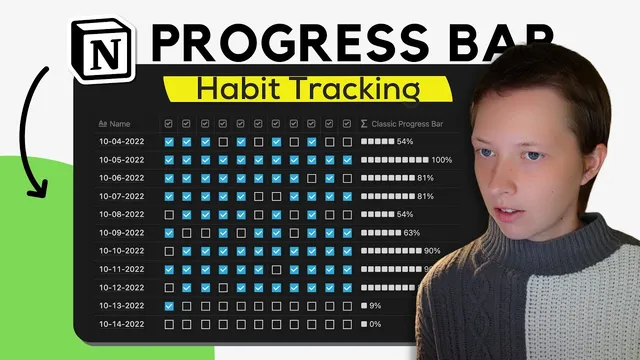
A Notion habit tracker can display a visual progress bar using nothing more than formula properties—one design uses a “classic” bar made from a sliced string of filled symbols, while a second “full” bar shows both filled and empty blocks. The key move is calculating a daily completion percentage from checkbox states, then converting that percentage into an index that drives Notion’s `slice()` function.
The setup starts with a habit database where each row represents a date and each day contains multiple checkbox properties (11 placeholder habits in the example). A new formula property named “classic progress bar” is created as a formula type. To compute progress, a “percent done” formula counts how many checkboxes are ticked by summing checkbox values converted with `toNumber()`—true checkboxes behave like 1s and false checkboxes behave like 0s. That total is divided by 11 to get a fraction, then multiplied by 100 and rounded down using `floor()` to produce a cleaner percentage value.
With the percentage in hand, the “classic” progress bar is built by turning the percentage into a number between 0 and 10, because the bar is represented as a string of 10 characters. The `slice()` function takes a string of filled-square symbols and returns only the portion up to a computed end index (based on `10 * percent done`). To prevent the bar from disappearing at low completion levels, an `if()` condition checks whether progress is under 10% (using `percent done < 0.1`). If so, it forces at least one filled symbol; otherwise it uses the normal `slice()` result. Finally, the percentage is appended to the bar by converting the numeric percentage into text with `format()` and concatenating it with a percent sign.
A second formula creates the “full progress bar,” which always renders the full row of blocks: filled squares up to the current progress, plus empty squares for the remainder. The filled portion again uses `slice()` with an end index of `10 * percent done`. For the empty portion, a second `slice()` is used in reverse logic—effectively taking away the first `10 * percent done` characters from a string of empty squares so the leftover empties align with the uncompleted portion. The same low-progress safeguard is applied with an `if()` statement so that under 10% the bar still shows one filled block. The percentage text is appended the same way, and the intermediate “percent done” property can be hidden once it’s no longer needed.
The practical takeaway: Notion progress bars become reliable once checkbox totals are converted into a bounded index and that index is fed into `slice()`—with `if()` used to handle edge cases like sub-10% completion. Separating intermediate calculations into temporary formulas makes the logic easier to debug and reuse for the next bar style.
Cornell Notes
Notion habit progress bars can be generated with formula properties by (1) counting checked boxes, (2) converting that count into a rounded percentage, and (3) using `slice()` to display a string of symbols that grows as completion increases. The “classic” bar shows only filled blocks up to `10 * percent done`, with an `if()` rule that forces at least one filled block when progress is below 10%. The “full” bar renders both filled and empty blocks by combining two `slice()` operations—one for filled squares and one for empty squares—again guarded by an `if()` for low progress. Appending the percentage requires converting numbers to text using `format()` so string concatenation works cleanly.
How does the habit tracker turn multiple checkbox properties into a single progress percentage?
Why does the progress bar use a 0–10 index instead of the raw percentage?
What role does `if(percent done < 0.1, ...)` play in the classic bar?
How does the classic bar build the filled portion using `slice()`?
How does the full progress bar create both filled and empty blocks?
Why is `format()` needed when appending the percentage to the bar?
Review Questions
- If `percent done` is 0.05, what does the `if(percent done < 0.1, ...)` logic force the classic progress bar to display?
- In the full progress bar, what changes between the filled `slice()` and the empty `slice()` so the empty blocks appear in the correct remaining positions?
- What exact type-conversion step prevents a Notion formula error when concatenating the percentage sign to the progress bar string?
Key Points
- 1
Count checked habits by summing `toNumber()` conversions of each checkbox property, then divide by the total number of habits (11 in the example).
- 2
Round down the computed progress using `floor()` after scaling by 100 to produce a stable percentage value for display.
- 3
Represent the bar as a fixed-length string of 10 symbols, then convert progress into a 0–10 index using `10 * percent done` for `slice()`.
- 4
Use an `if()` guard for sub-10% completion so the bar shows at least one filled block instead of disappearing.
- 5
Build the classic bar by slicing a filled-symbol string from the start to a computed end index.
- 6
Build the full bar by combining two `slice()` results: one for filled squares and one for empty squares, aligned to the same 0–10 index.
- 7
Append the percentage by converting numbers to text with `format()` so string concatenation doesn’t trigger type mismatch errors.